Volatility refers to a period when the price of an asset is moving up and down significantly in a short period. This asset could be stocks, cryptocurrencies, currencies, and commodities.
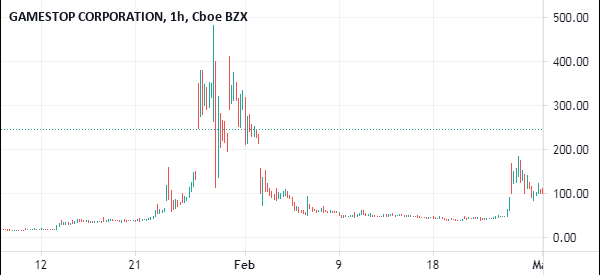
A good example of a volatile stock is GameStop. In February 2021, the company’s share price rose from below $20 and soared to $484 within a few days. It then dropped and reached $37 and then bounced back.
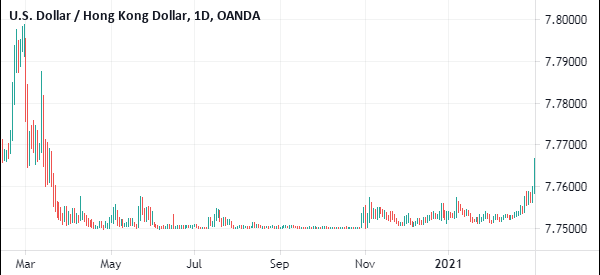
Some assets are rarely volatile. For example, the USD/HKD pair has spent at 7.7500 for the past few months because the Hong Kong dollar is usually pegged to the dollar. This makes it difficult to trade.
Why there are Periods of Low Volatility
Long-term investors like Warren Buffet buy companies and hold them for many years. For example, Buffet has held Coca-Cola’s stock for decades. By doing this, he has made money as the stock has continually moved up during this time.
Short-term traders, however, buy and sell stocks within a short period of time. They benefit from the huge moves that happen during the day. To make more money therefore, they require volatility which makes stocks and other instruments have huge moves.
Ho to Measure movements: the VIX index
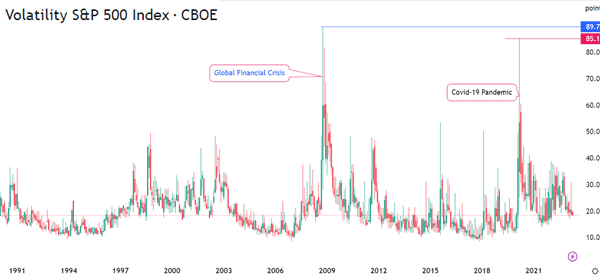
Investors measure volatility using the VIX index. A low Vix number implies a period with a few amount of volatility while a big number indicates a period of high volatility.
There are many factors that contribute to volatility. For example, an election in a major country or a referendum can contribute to volatility. Equally, other factors like trade deals or a major announcement from a major country can lead to volatility.
Recent events that have contributed to volatility include the American election, Wall Street Bets, Iranian Nuclear Deal, Russia war against Ukraine, and the performance of Treasury yields.
Related » How to Trade in Periods of High Volatility
Top volatility indicators in trading
An important aspect of volatility is that there are many indicators that people use in the market. These indicators can help you know whether a stock is volatile or not.
They can also give you signs when the stock is about to move away from a tight range to a breakout. Some of these top volatility indicators are:
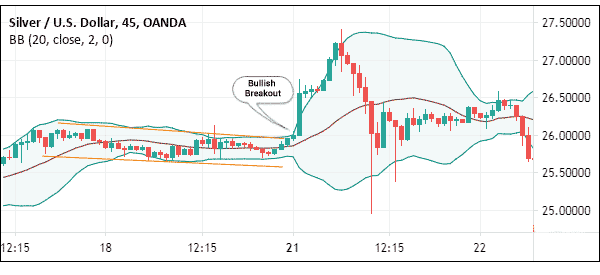
Bollinger Bands
Bollinger Bands is an indicator that is made up of the moving average and two standard deviations.
The three lines are usually very tight in a period of low volatility. They then widen when the asset has substantial volatility.
Average True Range (ATR)
The ATR indicator is the most popular volatility indicator. Its calculation is relatively complicated but is based on three key events.
First, you should calculate the current high less the current low. Next, you do the current high less the previous close followed by the current low less the previous close. The ATR usually rises in a period of high volatility and then dives when volatility dries up.
MACD
The Moving Average Convergence and Divergence (MACD) is an oscillator that was developed from moving averages. While it is not entirely a volatility indicator, the MACD can show you when an asset is volatile or not. A stock is less volatile when the two lines of the MACD are in the neutral level.
There are other volatility indicators that you can use, including the Relative Volatility Index (RVI), volatility oscillator, historical volatility, and volatility bands among others.
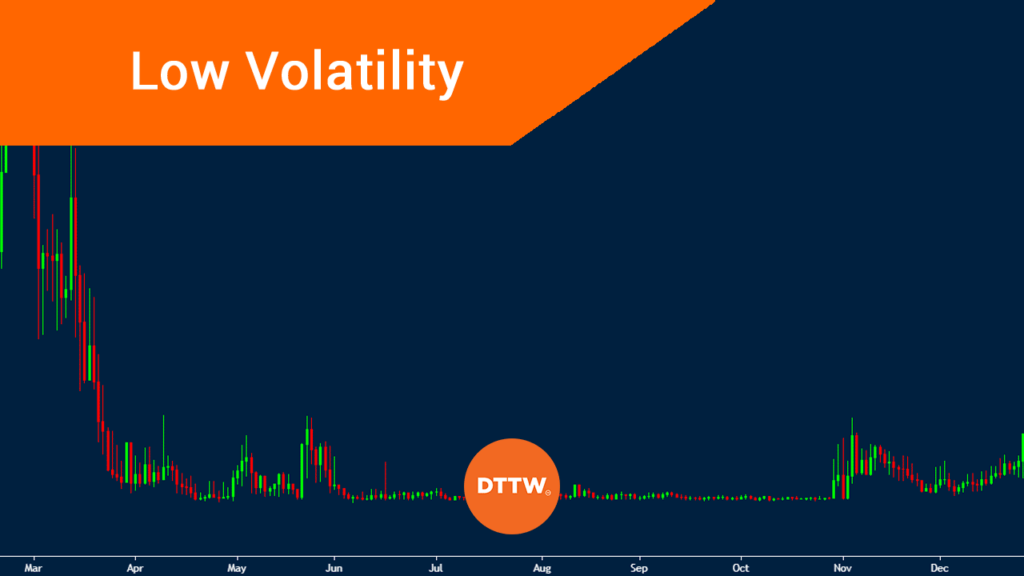
Recent period of low volatility
A few years ago, the world witnessed a prolonged period of low volatility, as shown in the chart below. In fact, in 2017, the CBOE Volatility Index (VIX) dropped to the lowest level on record.
This means that traders struggled to make money. A report from Bloomberg quoted several traders who were idle most times of the day because of this problem.
It is therefore understandable that quant traders like Renaissance Technologies have reported sluggish performance that year.
Market Making companies like Virtu Finance which benefit from volatility have reported weak earnings and resulted in other strategies like M&A to survive.
The lack of volatility has been caused by several factors such as the lack of major global events, or a shift from active management to passive management. In the latter method, investors park their funds in passive funds like mutual funds and ETFs.
Then, How do you make money during this time?
Find sectors or instruments that have some degree of volatility
One way of making money in periods of low volatility is to find sectors and instruments that have some volatility. The idea is that in most of these periods, many assets tend to have their own volatility.
For example, in stocks, some companies will announce weak earnings while others will announce significant management changes. This will lead to volatility in their stocks.
There are several ways of achieving success in such a period.
Watch for premarket movers
First, every morning, use platforms like Investing.com and Market Chameleon to find companies that are moving in the premarket.
Find important info
Second, try and find the reasons for this price action. A simple Google search can help you get this information. Alternatively, you can get this information from subscribing to a market watchlist.
Do your analysis
Uuse this information to trade these assets. To do this, combine the fundamental strategies like using the level 2 and time and sales, with technical analysis strategies to trade the assets.
Further, if the low volatility is happening in the stock market, you should try and find other areas showing high volatility. Some of these markets could be the cryptocurrencies, commodities, and currencies market.
It is common to identify potential opportunities across other markets.
Look globally
The United States and Canadian markets might not be volatile but that does not mean the same is happening in other countries. Real Trading gives you an opportunity to trade stocks from tens of countries. While a lot of caution is needed when trading stocks in these countries, it is possible to make money in their stock markets.
For example, if the US equities are less volatile, you can look at other countries like the emerging markets.
Consider other asset classes or instruments
Perhaps you have made money trading stocks. In these periods, you can do well by experimenting with other assets like currencies or commodities.
The rule is to take more time to find areas that are still volatile. You should spend more time researching new areas like commodities and emerging market stocks to find areas to make money in.
Consider scalping strategy
The other approach for trading in a low volatile environment is to consider the scalping strategy.
Scalping is an approach that involves buying and selling financial assets like stocks and currencies within a short period. The goal is to make small profits per trade several times per day. Traders using this approach open tens or even hundreds of trades every day.
For example, assume that you have a $1,000 account and you open 30 trades each making you a $5 profit. In this case, you can make $150 per day if everything goes right. Assuming that some trades will lose money, you can still make an average of $100 per day.
Wait for a breakout/ Wyckoff Method
The other approach for trading in a low-volatile market is for you to wait for a breakout. In most cases, stocks in a consolidation mode tend to have a bullish or bearish breakout over time.
This approach is best explained using the Wyckoff Method, which identifies the different stages that stocks go through.
The first stage, known as accumulation, is characterized by a long period of low volatility. It is then followed by the markup stage where demand outweighs supply. This stage is then followed by distribution and markdown.
Therefore, you can use the Wyckoff Method to time when a breakout is about to happen. You will then follow the trend and exit when it moves to the distribution zone.
FAQs
Is it a good idea to trade low-volatility stocks?
What is the difference between volatility and liquidity?
What are the main types of volatility?
External Useful Resources
- Further useful information can be found on Forbes.
