Trading can be challenging at times, especially for many new and inexperienced day traders. For many struggling traders, there is usually no easy way out because running a successful account requires skills and expertise.
In this article, we will look at some of the top trading strategies that many struggling trades (even some pros) can use to reboot their careers.
Using moving averages
One of the easiest trading strategies that anyone can master is using moving averages. A moving average is an indicator that looks at the average price of an asset in a certain period. The basic moving average is calculated by adding the asset prices and then dividing by the number of periods.
The simple moving average (SMA) has some challenges since it takes all periods equally. For example, in a 200-day moving average, the figure for today is usually the same for 200 days before. Therefore, there are several moving averages that solve this situation.
Examples of these averages are:
- exponential moving average (EMA)
- smoothed moving average (SMMA)
- volume-weighted moving average (VWMA)
All these moving averages are used the same way in day trading.
Trend Following
There are several strategies for using the moving average indicator. First, you can use the moving average in trend-following. This is where you decide to buy an asset when the price is above a moving average or short it when the price is below the MA.
The goal is that an asset will continue rising as long as it is above the MA and vice versa. A good example of this is shown in the chart below. As you can see, the Nasdaq 100 index remained above the 25-period moving average for a while.
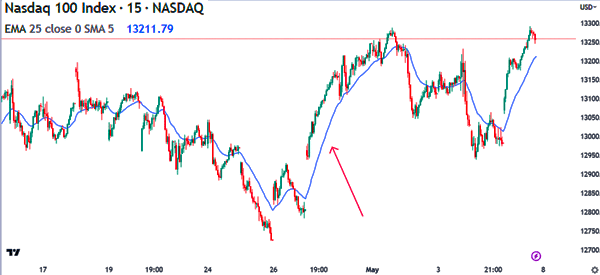
Therefore, a simple strategy is to find an asset that is trending, apply a moving average, and then place a bullish trade. You should then exit the trade when the asset moves below the moving average.
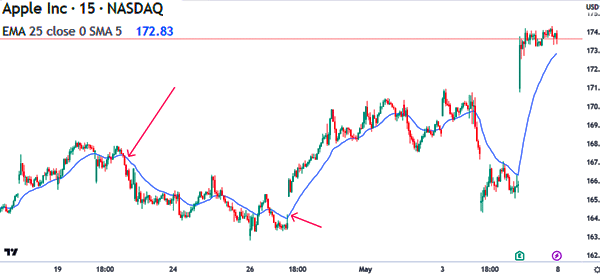
Crossover
The other simple strategy for using the moving average is to simply wait for a crossover. This process works in a relatively simple way. The idea is to apply a moving average on a chart and then wait for the asset to cross it.
If it crosses it at the top, this is a sign that bears are prevailing. On the other hand, if it crosses it at a lower side, this is a sign that the price will continue rising in the near term.
What to consider when using moving averages
Using moving averages in this approach is a relatively easy process. There are several things that you can do to improve your outcome when using the moving average strategy. First, always incorporate volume in your trading charts.
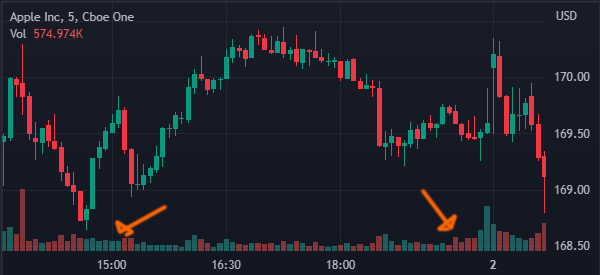
The idea behind volume is simple. If an asset rises above the moving average in a high-volume environment, there is a likelihood that the price will continue rising for a while. On the other hand, if the volume is limited, the gains will not have legs.
The other important thing to note about moving averages is that the period or the length matters. In most periods. As shown above, We used the 25-period moving average in trend-following. Some people use a different figure, with some using the 10-period and others using the 7-period moving average.
Finally, you should consider the type of moving average that you will use. Some of the most popular types of moving averages are exponential, smoothed, volume-weighted, and least squares among others.
Using the VWAP strategy
In addition to using moving averages in day trading, the other strategy that you can use well is the Volume Weighted Average Price (VWAP). While some believe that the VWAP is similar to moving averages, there is a big difference.
The VWAP simply looks at the average price of an asset in a certain period when adjusted with volume. Therefore, the indicator can only be used in intraday charts such as 5-minute and 15-minute. It cannot work in longer charts like daily and weekly.
The concept of using the VWAP is the same as the moving average. In most periods, traders enter a bullish trade whenever the price is above the VWAP indicator. Similarly, they enter a bearish trade when the price moves below the VWAP indicator.
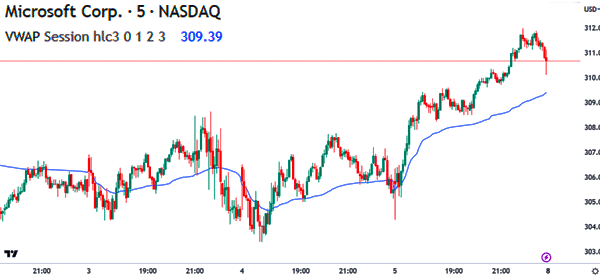
For example, in the chart below, we see that Microsoft shares have been in a strong bullish trend in the past few days. The shares are above the VWAP indicator meaning that traders should maintain a bullish trades as long as it is above the indicator.
The other alternative is where a trader decides to wait for the chart to continue dropping and hit the VWAP. If it moves below the VWAP, it is a sign to start a bearish trade. On the other hand, you can place a buy trade if it rejects moving below the VWAP indicator.
Risk management
Moving averages and VWAP are not always perfect. Therefore, it is important to use several risk management strategies to protect your downside.
Some of the most popular risk management strategies include having a stop-loss for all your trades, practicing these strategies in a demo account before moving to a live account, reducing the amount of leverage, and doing proper position sizing.
Risk management will help you to protect your account in case your trades don’t go right.
Summary
In this article, we have looked at the two most popular trading strategies for people who are struggling in the industry.
If you can master the concept of moving average and VWAP and risk management, you can be able to trade in all market conditions successfully.
