The Supertrend is an indicator that helps traders identify buy and sell signals based on the overall trend. It was conceived and developed by Olivier Sebam, a French writer and financial advisor whose books have been translated widely around the world.
In this article, we will look at what the Supertrend is and how you can use it effectively in the financial market.
What is a trend?
The foundation of the supertrend indicator is the trend. A trend refers to a situation where the price of an asset is moving upwards or downwards for a certain period of time. Traders mostly make their money when an asset’s price is trending upwards or downwards.
When it is rising, they make profits by buying the stock. Similarly, they make money when an asset’s price is falling by shorting it. Therefore, most technical indicators like moving averages and Bollinger Bands aim to identify these trends.
Why is a trend important in trading?
A trend is an important thing in the financial market. Indeed, it is the most important thing that traders look at since they want to buy an asset whose price goes up. They also want to sell short an asset and its price moves in a bearish trend.
Therefore, most successful traders are those who identify trends early and hold them to “maturity”.
What is the Supertrend indicator?
The Supertrend is a relatively unpopular technical indicator that was developed – as stated above – by Olivier Sebam to help traders identify trends and know when to buy or sell a financial asset. The indicator is not found as a default in TradingView and MetaTrader. Still, you can find custom-made Supertrend indicators in the marketplace.
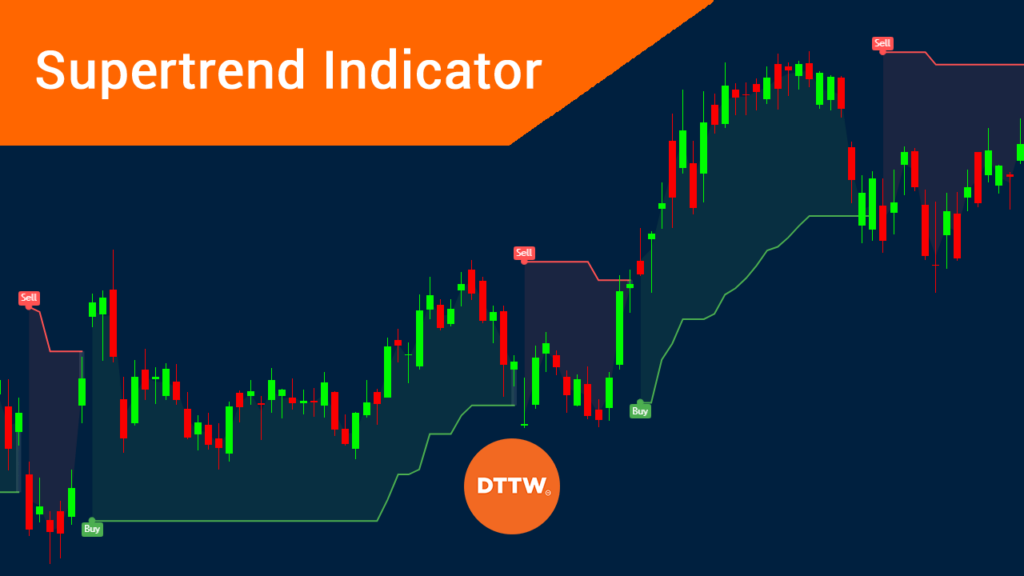
When applied on a chart, the supertrend indicator is visible with its two colors. While they can be changed, the default colors are usually red and green. When it is green, it is a signal to buy an asset while when it is red, it is a sign to sell an asset.
The supertrend indicator works well across all timelines. It can work in shorter timeframes like the 5-minute or longer charts like daily and weekly charts.
»Is It Possible to Use Different Time Frame Analysis in Trading?«
Formula to calculate it
Calculating the supertrend indicator is a relatively complex method. Indeed, if you don’t have a good mathematical background, there is no need for knowing the formula of this indicator. Instead, all you need to know is how to apply it in a chart and apply it.
Anyway, let’s go over the calculation process.
Step 1 – First, you need to calculate the basic upper band. This is done by first adding the asset’s high and low prices. You then divide the result by 2 and add the multiple of the multiplier and the average true range (ATR).
ATR is an indicator that is mostly used to identify whether there is volatility in the market or not. You can find how the Average True Range indicator is calculated here.
Step 2 – Second, you need to calculate the basic lower band. You do this by adding the high and low and dividing the result by 2. You then subtract the multiplier multiplied by the ATR.
To get the Supertrend, if the current close is equal to or less than the current final upper band, then the current final upper band else current final lower band.
The supertrend indicator is calculated ysing the following formula:
| Up = (high + low) / 2 + multiplier x ATR |
| Down = (high + low) / 2 – multiplier x ATR |
| ATR calculation [(Prior ATR x 13) Current TR] / 14 |
Supertrend Indicator best setting
Before you use the Supertrend indicator, you need to make several changes in the settings. By default, the Average True Range (ATR) period used is 10 days. You can change this to meet your trading needs.
You also need to select the multiplier. The default is usually 3. You need to select the indicator timeframe, which should be the same as that of the chart. For example, if you are using the daily chart, you should ensure that the timeframe for the indicator is also similar.
Other important settings you can change are the whether you want to change the ATR calculation method, show the highlighter, and show the buy and sell signals. You can also change the colours of the indicator.
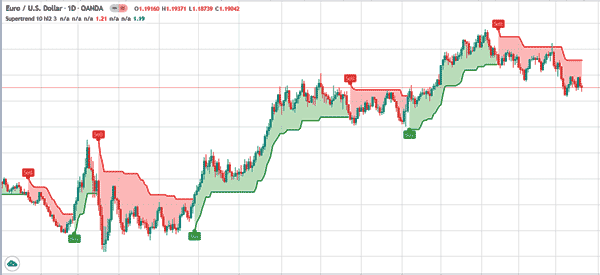
The chart below shows the Supertrend that is applied in the daily EUR/USD pair. The default settings are used
How to use the Supertrend indicator
Using the Supetrend indicator is a relatively easy process. Indeed, it is one of the few indicators that tell you when to buy or sell an asset.
Related » The 6 Best Entry and Exit Indicators for Day Traders
Before you use it, it is important that you ensure that the chart is not ranging. Like most indicators, using it when the market is ranging is not ideal, because it will produce a false signal. Therefore, ensure that the market is either rising or falling.
After applying the indicator, look at the colour and the recommendation. If it says that you should buy the asset, you should buy and vice versa.
However, it is always recommended that you use other indicators to verify what it is saying. Also, you should ensure that you conduct a multi-time analysis since it will tell you whether the signal is valid.
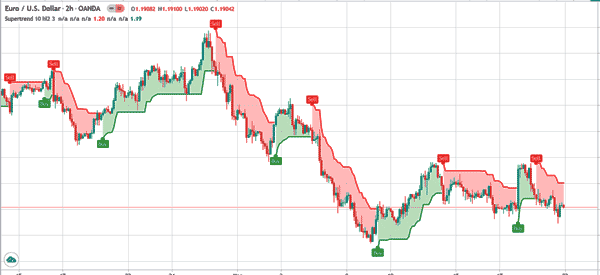
For example, the chart below shows that the EUR/USD is also bearish on the four-hour chart.
Identify buy and sell signals
As shown above, buy and sell signals are well marked in the supertrend indicator. A buy signal emerges when the price moves above the green part of the indicator.
On the other hand, a sell-signal is seen when it moves below the red section of the indicator. However, doing a multi-timeframe analysis will help you identify the best support and resistance levels.
Summary
In this article, we have looked at the relatively unknown technical indicator. Yet, it is also one of the easiest to use in the financial market. To use it well, we recommend that you take time to practice with a demo account.
External useful Resources
- Combining the SuperTrend Indicator With Moving Averages in a Trading Strategy – Data Driven Investors
