Breakouts are some of the most important parts of day trading and even investing. They are an excellent way to trade.
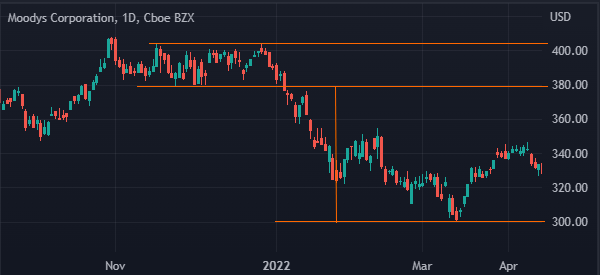
Ideally, when you can capture a trade when a breakout is happening, it can be highly profitable even in the long term. For example, in the chart below, a trader who was able to capture a 20% gain with three months.
In this article, we will look at how breakouts happen and some of the top signs that a breakout will fail.
What is a breakout?
A breakout is a situation when an asset moves above or below a consolidation zone since tight ranges don’t last forever. The breakout can either be bullish or bearish. In the first example above, the breakout was bearish.
Breakouts happen for a simple reason. When a price moves above or below a certain resistance and support level, investors jump in hoping that the new trend will continue.
For example, assume that a stock is trading between $10 and $12. It has stayed in this range for a few weeks. Now, if the stock manages to move to $13, one will assume that a new bullish breakout has happened. As such, they will buy the stock hoping that it will continue with the new trend.
How breakouts happen
There are three important patterns that happen in a chart. These are:
- Trends
- Volatility
- The range markets
Trends
First, the asset can move in an upward or downward trend. This is usually one of the best times to buy or sell and hold a financial asset in the short or long term.
We need to split trend trading into two other types. A trader may decide to follow a trend already in place or wait until signs of a reversal from bullish to bearish or vice versa.
Volatility
Second, the asset can be in a volatile period where it moves up and down without any meaningful trend. Many traders make a lot of money when trading in these volatile ecosystems. However, many others, especially new ones find it difficult to make money in volatile markets.
Related » How to Trade Profitably in Periods of High Volatility?
Range
Finally, an asset can be in a tight range where it is moving sideways or where it is not moving in any specific direction. In most cases, this is a difficult time to trade.
Ranges happen when investors and traders are unsure about whether the bullish or bearish trend will continue. In most cases, it happens when the market is waiting for major news or economic data or after a major event.
Related » How to Trade Profitably in Range Bound Markets
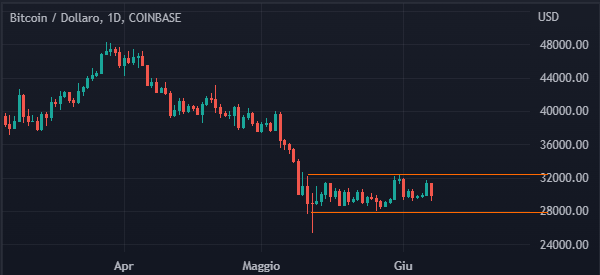
A good example of a range is shown in the chart below. As seen, Bitcoin formed a strong consolidation pattern after it fell to a multi-month low.
Signs that a breakout will fail
There are several strategies to identify when a breakout will fail. Here is how to spot some signs of a false breakout.
When a breakout is not supported by volume
The first sign that a breakout will fail is when it is not supported by volume. As you will find out, a good breakout happens when the financial asset is supported by high volume.
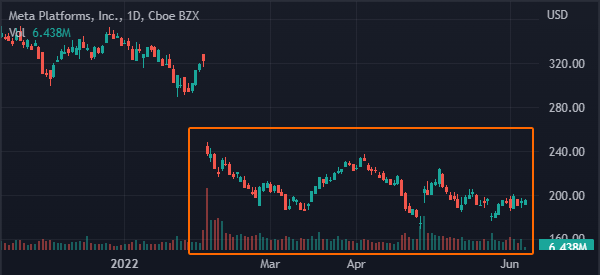
As shown below, when a bearish breakout on the Meta Platform stock happened, the volume of the asset was bigger than what was there before the breakout happened.
Therefore, we recommend that you always check the volume of the asset to determine whether the new trend will continue.
When in doubt, zoom out
Another way to confirm whether a bullish or bearish breakout has happened is by doing what is known as zoom out. This is a relatively simple concept that is known as multi-time analysis. The idea is to look back and see the key levels in the market.
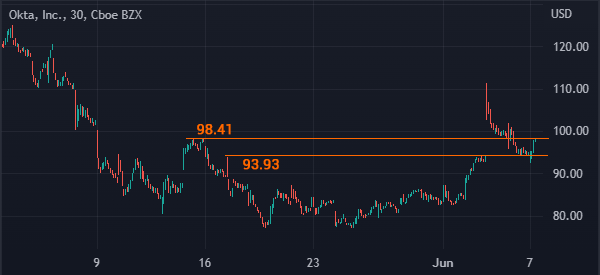
For example, as we can see below, the OKTA share price made a strong bullish breakout when the company published strong results. It rose to a high of $111.4.
Now, looking at the 15-minute chart, it is hard to conceptualize the upper part of this breakout. By looking at this chart, we can be certain that the stock will retest the key support at $93.93, which was the highest level on May 17th.
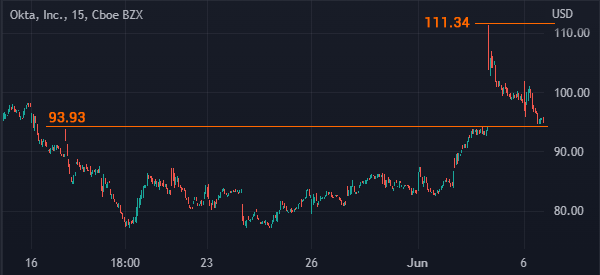
However, if we zoom out to the 30-minute chart, we see that there is another support level to watch at $98.1. This is a notable level to watch since it was the highest point on May 16th.
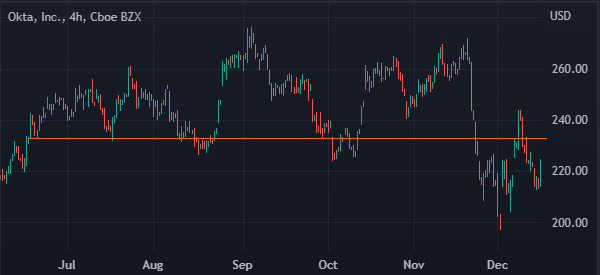
When the break and retest fails
The next key sign that a breakout will not hold is when the break and retest pattern fails. This is a popular pattern that happens when a breakout happens. It happens when an asset price retests a key support and resistance level.
In most cases, this break and retest pattern is usually a sign that the new trend will continue. However, at times, the asset’s price will invalidate these levels as shown below.
In this chart, we see that the stock made a bearish breakout but the break and retest failed. As such, this was a sign that the breakout was not all that strong.
Summary
Breakouts are some of the most important patterns in the market. However, as we have seen, there are times when these breakouts fail.
In this article, we have looked at some of the most important parts to watch that signal that a breakout will fail. The rule when trading these breakouts is to always wait before you place a trade when a breakout happens.
External useful resources
- Failed Breakouts from Trend Channel Lines – Tradingpedia
