Technical analysis is an important concept in trading and investing. It involves looking at charts and assessing the next move. In most cases, traders use technical indicators like the moving average, relative strength index, MACD, and the Stochastic Oscillator.
In addition to this, technical analysis includes chart analysis strategies, where traders look at patterns like head and shoulders and cup and handle.
Define technical indicators
Technical indicators are tools created using mathematical concepts to help traders and investors predict the next direction of an asset. Most of these indicators have been in use for many years while others are still being developed.
Technical indicators can be divided into several categories. One way is to divide them into overlays and oscillators. Overlays are indicators that are plotted on the same scale as asset prices. There are many such indicators, with some of them being Ichimoku, moving averages, and Bollinger Bands.
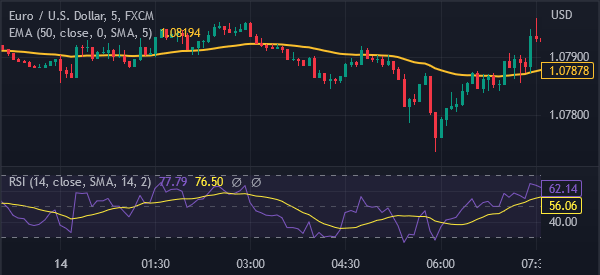
Oscillators, on the other hand, are usually plotted separately from the chart. In most periods, these indicators are plotted below the main chart. Traders can use tools to change where they appear. In the chart below, we see that the moving average is the overlay while the Relative Strength Index (RSI) is the oscillator.
Types of technical indicators
There are several types of indicators, based on how they are calculated and used. The most popular types of these indicators are:
Trend indicators
Trend indicators are tools, often overlays, that guide traders on the direction of an asset’s trend. For example, the moving average indicator seeks to show the direction that an asset is moving in.
These indicators are mostly used in trend-following. Some of the most popular trend indicators are moving averages, Bollinger Bands, Ichimoku Kinko Hyo, and Keltner channels among others.
Oscillators
The other type of indicator is known as an oscillator. These ones are designed to provide more details about the current asset level. In many periods, oscillators indicators are used to show whether an asset is being overbought or oversold. Examples are the RSI, MACD, Stochastic Oscillator, and Commodity Channel Index (CCI).
Volatility indicators
These are technical indicators that measure the rate of change of an asset price. In other words, they show whether an asset is being volatile or whether it is in a tight range.
Some people focus on trading when there is strong volatility while others love when things are calm. Examples are:
- Average True Range
- Relative Volatility Index
- Chaikin Volatility Indicator
- Twiggs Volatility Indicator
Volume
These are indicators that show the overall volume of a financial asset. They are important because volume has an impact on an asset’s price.
When an asset jumps in a low-volume environment, it means that the move is likely not supported and that it will likely resume the downward trend. The most common volume indicators are Volume and Accumulation and Distribution.
Most common technical indicators
There are thousands of technical indicators. TradingView provides over 150 prebuilt indicators. However, most of them are not popular among traders at all. Instead, traders focus on just a handful of them. Here are the most popular indicators.
Moving averages
Moving averages are often seen as the foundation of technical analysis. In fact, other indicators are built using concepts of MAs. These indicators seek to explain the current price of an asset compared with its average in a certain period.
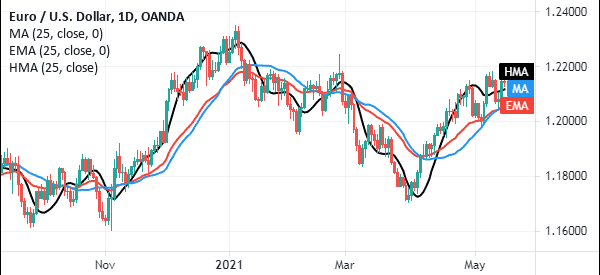
There are several types of MAs, including exponential, volume-weighted, smoothed, and simple among others. The chart below shows the EMAs (red), simple (blue), and hull moving average (black) indicator applied in a chart.
Relative Strength Index
The RSI is another indicator that seeks to calculate the rate of change of an asset. It is mostly used to identify the overbought and oversold levels of an asset.
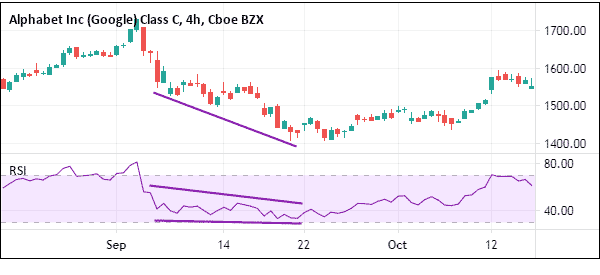
The indicator is also used to find divergences and in some cases, it can be used in trend-following. It is one of the most popular ones just because it is versatile and effective. A good example of this indicator is shown below.
Bollinger Bands
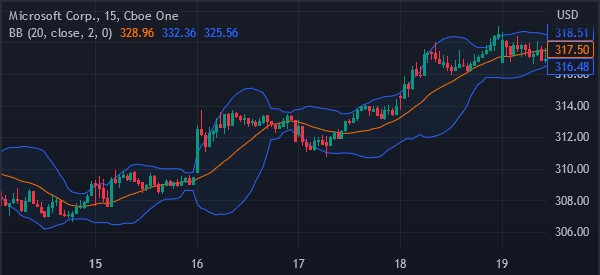
Bollinger Bands is an indicator made up of three lines. The middle line is the moving average in a given period while the upper and lower lines are the standard deviations of the assets.
It is one of the most popular indicators used to measure an asset’s volatility. The chart below shows the Bollinger Bands applied in Microsoft shares.
MACD
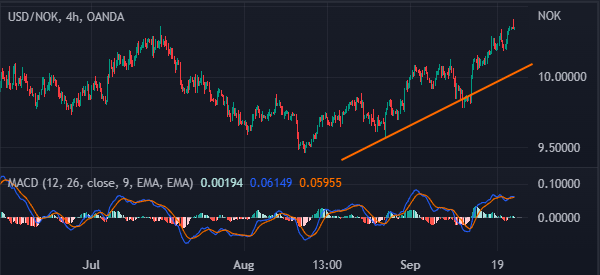
The moving average divergence and convergence (MACD) indicator is a tool that is created by converting typical moving averages into oscillators. It is made up of two lines: MACD and the signal line.
In some cases, the indicator has histogram bars that move up and down the neutral point. The chart below shows the MACD applied in the USD/NOK.
Stochastic Oscillator
The Stochastic Oscillator is a tool that shows the location of an asset’s close relative to the high-low range in a certain period. It moves between 0 and 100 and is mostly used to show overbought and oversold levels in a chart.
Key principles and best practices for using technical indicators
How to choose the right indicator
There are thousands of technical indicators in the market. You can even create your own indicator if you have some experience in the industry. However, most traders focus on just a handful of these indicators. There are several things you need to look at when thinking of the best indicator to use.
First, consider your trading strategy. If you are a trend-following trader, you should focus on trend indicators like moving averages and Bollinger Bands.
Second, consider market conditions. If the market is moving sideways, it does not make sense to use trend indicators or oscillators.
Third, consider your goal of trading. For example, if your goal is to buy and hold an asset for a long period, use a long-dated indicator.
How to combine indicators
Most experienced traders don’t use too many indicators at once. Instead, they focus on just a few indicators. As you have likely seen in TraderTV, the traders typically focus on the Volume Weighted Average Price (VWAP).
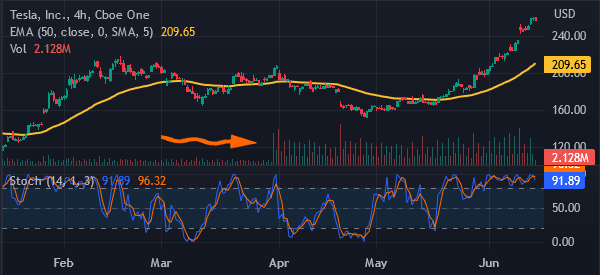
It is also common for a trader to combine a few indicators. One way of doing this is to use a trend, volume, and oscillator and interpret it. In the chart below, we see that Tesla shares moved above the 50-period moving average while the Stochastic Oscillator jumped above the overbought level in a high-volume environment.
How to use technical indicators effectively
Some of the top strategies for using technical indicators well are:
- Learn before you use – You should learn the basics of the technical indicator before using it in the market.
- Don’t use too many of them at once – Using too many technical indicators at once can lead to mixed signals. Therefore, just use two or three indicators when trading.
- Combine with chart patterns – You should combine technical indicators with chart patterns. The most popular patterns are double-top, double-bottom, and head and shoulders.
- Don’t forget volume – An important thing to consider is that you should never forget to include volume in your analysis.
- Test and backtest – You should consider testing the indicator and backtesting it in a demo account before you move to a live account.
- Master a few indicators – You should master just a small number of traders instead of using many of them.
Backtesting and optimizing indicators
As mentioned above, it is always important that you backtest your indicators before you use them in your trading account.
For starters, backtesting is the process of using historical data to predict the future performance of an asset price. In most periods, this backtesting happens in a demo account, which provides you with live data and tools. The difference is that the demo account does not have real money. As such, it does not put your account at risk.
Tools like TradingView and MetaTrader provide you with a backtesting feature that you can use to test the indicator or strategy. A good example of this is shown in the chart below.
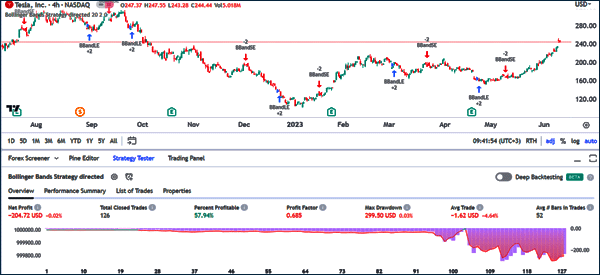
As you can see, we have backtested the Bollinger Bands strategy and seen that it opened 126 trades and then had a net loss of $204.
Pros and cons of backtesting an indicator
There are several benefits of backtesting an indicator. First, it is an easy way to show you whether an indicator works or not. For example, the chart above, we have seen the strategy did not work out well since it led to a loss.
Second, backtesting gives you time to change or tweak the indicator to optimize it well. For example, if you are backtesting the 25-day moving average and it generates a weak result, you can easily tweak it to include the 50-day MA and see the result.
Third, backtesting saves you a lot of time since it takes a short period to do it. In the example above, the process took a few seconds.
On the other hand, there are several cons of this strategy. First, backtesting uses historical data, which is not a good representation of what will happen. Second, backtesting can show results that differ from the real results (that’s why you have to use real time data in this platform as well).
How to forward test an indicator
In addition to backtesting, we recommend that you do forward-testing your indicator. This is a process where you stay in a demo account for a few months using live data and testing the indicator.
The benefit of forward testing is that it will show you whether the indicator works. At the same time, it will show you the conditions where the indicator works well.
Advanced trading strategies using technical indicators
In this article so far, we have looked at some of the top things to consider when trading using technical indicators. Here are some of the top advanced strategies to use when using some indicators.
Divergences
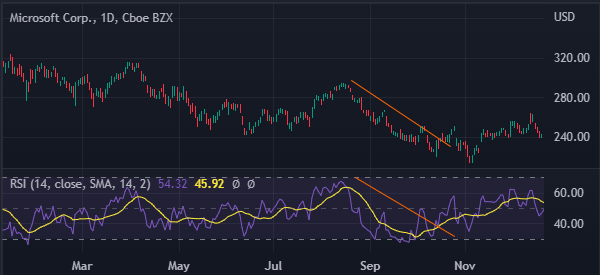
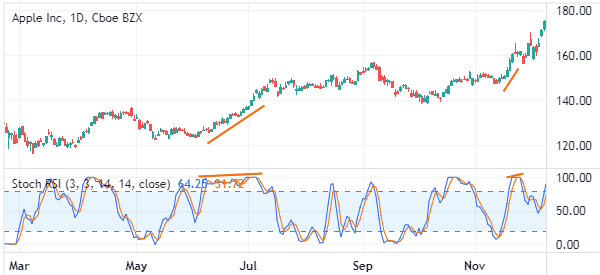
Oscillators like the Relative Strength Index (RSI) and the Stochastic Oscillator are mostly used to find overbought and oversold levels. However, at times, you can use them to trade divergences. A divergence situation is where an asset price is rising while the oscillator is moving in the opposite direction and vice versa. In most periods, when this divergence happens, it results in a breakout in the opposite direction.
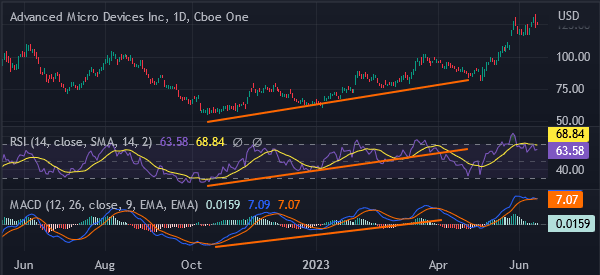
A good example of this is shown in the chart below. As shown, the RSI was moving downwards while the price was moving sideways. This situation resulted in the stock having a bullish breakout.
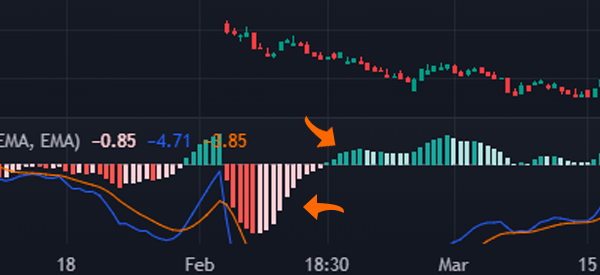
Trading convergences
Convergences are relatively easy to understand. A convergence situation happens when an oscillator is moving in the same direction as the asset. When there is convergence, it is a sign that the trend will continue in the foreseeable future. It is always recommended to use at least two oscillators to confirm the convergence. The chart below shows the convergence that is confirmed using the Relative Strength Index and the MACD.
Multi-timeframe analysis
The other important aspect to consider when using the indicator is multi-time frame analysis. This is a situation where a trader looks at a chart in different timeframes. In some cases, an asset will be in the overbought level in the four-hour chart and oversold in another time frame.
As a trader, we recommend that you always do a multi-timeframe analysis when you place a trade. You can look at the hourly chart, 30-minute, and 5-minute chart and identify the different trends.
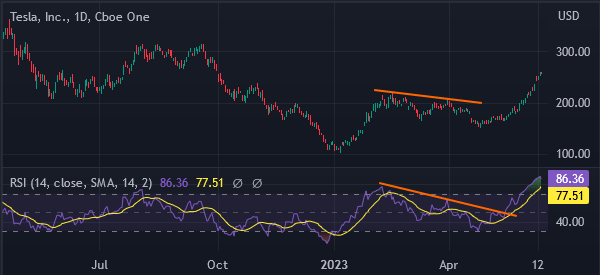
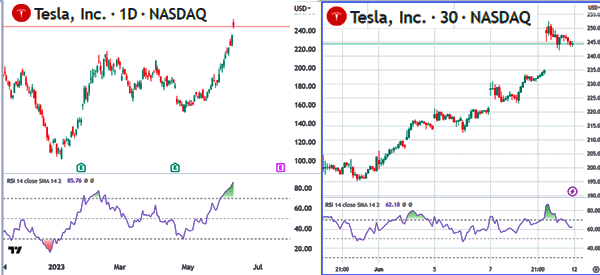
As shown below, the Tesla stock price is moving from the overbought level in the 30-minute chart. In the daily chart, however, the Relative Strength Index (RSI) is pointing upwards as it remains at an overbought level.
How to combine different indicators effectively
Day traders should always combine different indicators when trading. This means that they should always use at least two tools when making decisions. Still, this is not to say that they should add tens of traders in a chart. As we noted above, this is usually the wrong strategy.
Instead, we recommend that you use a maximum of three indicators in a chart. In most periods, you should use the three types of indicators to determine whether to buy. For example, you can use the volume-weighted average price (volume), moving average (trend), and the Relative Strength Index (oscillator). You should then make your decision using the outcome of these indicators.
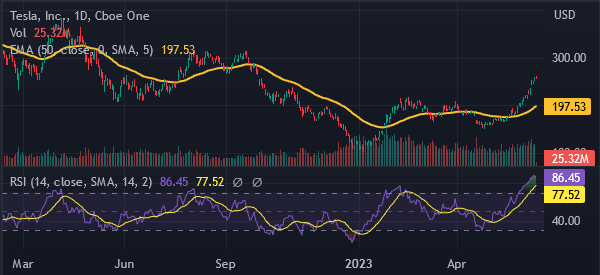
The chart below shows Tesla shares with the moving average indicator, Relative Strength Index, and volume. This chart can be interpreted as follows. It is above the moving average, which is a bullish view. But it is getting oversold, signaling that a short pullback could happen.
Other trading strategies that incorporate indicators
There are several strategies that incorporate technical indicators. Some of the most notable ones are:
- Breakout strategy – Breakout is a situation where an asset in consolidation makes a bullish or bearish breakout. You can use technical indicators like the RSI and MACD to trade breakouts.
- Trend following – This is a strategy that looks to buy an asset whose price is rising and a short one that is falling. Trend indicators like Bollinger Bands and the moving average.
- Mean reversion – Mean reversion is a situation that implies that assets in extreme levels tend to return to their “normal” levels. The top indicators to trade mean reversals are moving averages and Bollinger Bands.
Case study of using technical indicators
In this article, we have looked at everything you need to know about technical analysis and indicators. Now, we will explain how you can use technical indicators from scratch. The example will focus on Microsoft, the second-biggest company in the world.
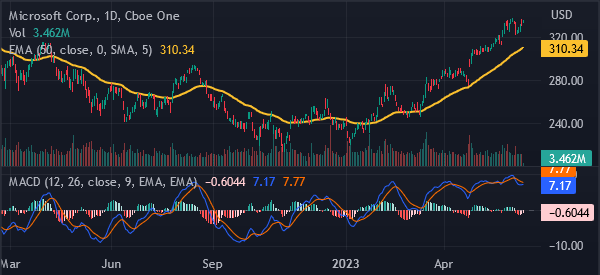
First we see that the shares are rising and then we add the 50-day moving average. We see that the stock is above the moving average, which is a positive thing. But we also see that the stock is significantly higher than the moving average, pointing to a potential mean reversal.
The volume has moved downwards while the MACD has started pointing downwards. This is a sign that the stock will soon pull back temporarily.
Summary
In this article, we have looked at the concept of technical analysis and how to use them in day trading. We have assessed the different types of indicators (trend, oscillators, volume, and volatility). Further, we assessed the most popular indicators that you will likely use in the market (moving average, RSI, MACD, and Stochastic Oscillator).
The article also looked at the key principles that traders use when trading using technical indicators. Most importantly, we assessed the top strategies to use.
