The Triple Exponential Moving Average (TEMA) is a popular technical indicator that attempts to remove the lag in moving averages. It was created by Patrick Mulloy, a mathematician and trader who published its ideas in the Technical Analysis of Stocks and Commodities.
In this article, we will look at what the TEMA indicator is, how it works, and some of the top strategies to use it in the market.
What is the TEMA indicator?
To understand what TEMA is, you need to understand what moving averages are. As we have written before, moving average is an indicator that attempts to find the value of a currency pair based on its average price.
The most standard type of moving average is known as simple MA. It is calculated by just adding the prices of an asset and then dividing by the periods. While this moving average works, analysts believe that it has a lot of noise since it takes all periods equally.
For example, when calculating the 200-day moving average, you will simply add the prices and then divide by 200. This is often a challenge since in real sense, recent prices should have more weight.
Therefore, mathematicians have attempted to remove this noise by coming up with several approaches. This explains why there are several types of MAs like exponential, smoothed, weighted, and volume-weighted.
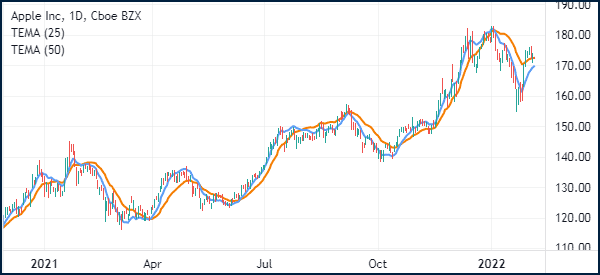
The TEMA indicator comes from the exponential moving average. It aims to reduce the overall lag of traditional EMAs by making it more responsive. The chart below shows the Apple stock price with a 50-day and 25-day TEMA indicator.
How is TEMA calculated?
The TEMA indicator is calculated in a number of steps. First, as the name suggests, since this is an exponential moving average, you need to calculate the first EMA.
First, you need to calculate the overall simple moving average. This is where you add prices of an asset and then divide with the total periods. Second, you should now apply a multiplier to each period. Finally, the EMA is calculated using the following formula:
| EMA = {(Close – EMA (previous day)} x multiplier + EMA (previous day) |
After doing this, you should follow the following steps to get the TEMA indicator.
EMA1 = EMA of the price
EMA2 = EMA of EMA1
EMA3 = EMA of EMA2
After all this, you should calculate the TEMA indicator using the following formula:
| TEMA = (3 X EMA1) – (3 X EMA2) + (EMA3) |
How to read the TEMA indicator
The interpretation of TEMA is similar to how other moving average indicators are interpreted. When the indicator is at the same price with the asset, it is assumed that it is fairly valued or that there is no volatility in the market.
Second, when TEMA is significantly below the current price, it is assumed that the price is getting overvalued. And finally, when the price is significantly above the price, it is assumed that the asset is a bit undervalued.
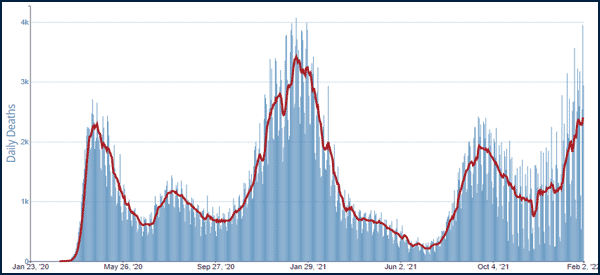
The logic behind this is simple. A good way to describe it is to use the Covid-19 data published in the United States. For example, in the chart below, we see that the moving average of the number of deaths is lower than the current numbers. This can be interpreted to mean that the situation is worsening.
Strategies for using the triple exponential moving average
The TEMA indicator is used in a similar approach to other moving average indicators. There are three main approaches in which it is used.
First, it is used in trend-following. This is where you apply the indicator in a chart and then look at its price action. If the price is rising, you can buy the asset as long as it is above a selected TEMA figure.
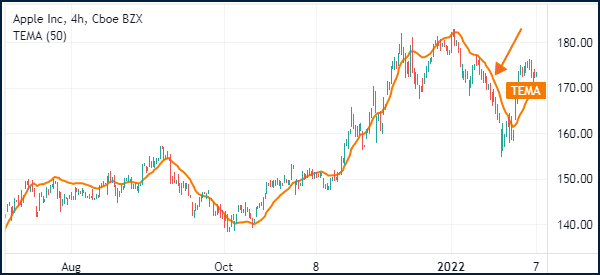
The challenge when using the triple exponential MA, in this case, is that it is usually more responsive than other moving averages. As such, it is a bit difficult to use it in trend following. A good example of this is shown in the chart below.
Second, in theory, you can use the TEMA indicator to trade reversals. A reversal is a situation where the price of an asset ends an existing trend and starts a new one.
You can use this approach by setting two moving averages of different lengths and seeing when they make a crossover.
Third, you can use TEMA by combining it with other technical indicators like oscillators like the Relative Strength Index and MACD.
EMA vs TEMA
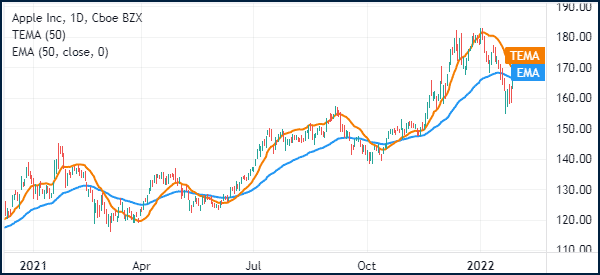
A commonly asked question is whether there is a difference between the standard EMA indicator and the TEMA indicator. There is, indeed, a difference between the two.
The biggest one is that the TEMA indicator tends to be more responsive to price movements. As such, it is more difficult to use by most traders.
The chart below shows the TEMA and EMA indicators applied in a chart. As you can see, the EMA is simpler to use than the triple exponential.
TEMA vs DEMA
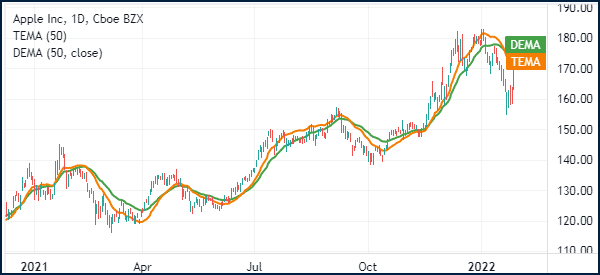
The idea behind the double exponential moving average (DEMA) is the same as that of the TEMA indicator. The goal is to reduce the lag that is in the EMA indicator. Therefore, the two indicators are used in the same way.
You can use them to find reversals or continuations. TEMA is more responsive than the DEMA indicator as shown below.
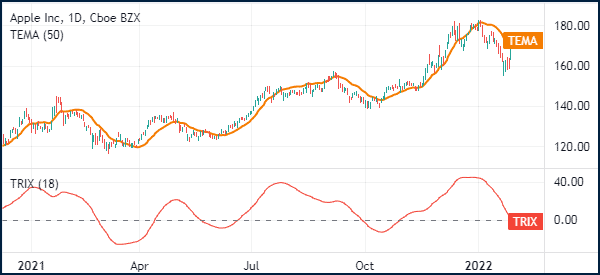
TEMA vs TRIX
Another commonly asked question is whether there is a similarity between TEMA and the Triple exponential average (TRIX) indicator. While the two sound the same, they are different since TRIX is an oscillator as shown below. The latter is therefore used to find extreme levels.
Summary
The Triple Exponential Moving Average is not a popular technical indicator in the market. Many traders argue that the indicator goes too far to reduce the lag that exists in the market.
Therefore, we recommend that you spend time doing more research about the indicator and test it in a demo mode.
External useful resources
- Moving Averages Guide: SMA vs EMA vs WMA vs TEMA – The Forex Chronicles
