A breakout refers to a period where a financial asset suddenly moves above or below a certain range or consolidation phase. It is one of the most important situations that traders focus on in the market.
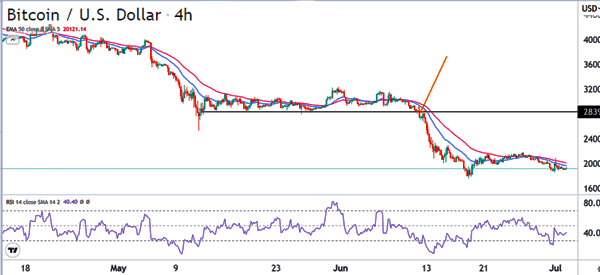
For example, in the chart below, we see that Bitcoin found a strong support at around $28,396 in May and June of 2020. After that, It made a strong bearish breakout.
Therefore, in this article, we will identify some of the most important patterns to identify as you trade breakouts.
Why trade breakouts?
Breakouts play an important role in the market both for investors and traders. They are useful for two main reasons.
First, a new trend usually emerges after the breakout happens. Therefore, trading breakouts is one of the best approaches of making money during a bullish or bearish breakout.
Second, a breakout usually comes after a period of consolidation. In most cases, it is usually really difficult to make money when a financial asset is in a consolidation mode. As such, a breakout gives you an opportunity to capture a trend early and ride it for a while.
For example, short-sellers who were able to capture the bearish breakout pattern shown above managed to generate strong returns as the price made a bearish breakout.
But you must pay close attention to some of the signals you can read in the charts because these are reliable symptoms of a false breakout.
Types of breakouts
There are several types of breakouts that traders need to understand in the market. These include:
- Bullish breakout – This is a situation where a financial asset moves makes a strong bullish move after some time of consolidation.
- Bearish breakout – This is the opposite of a bullish breakout. It usually happens when the asset breakouts significantly lower.
- False breakout – This is a situation where an asset moves out of a key support or resistance and then the breakout fades.
- Continuation breakout – This is a breakout that happens in the direction of the existing trend. An example of this is the Bitcoin chart shown above.
- Reversal – This is a breakout that happens in the opposite direction of a trend.
Best breakout patterns to trade in charts
Triangle patterns
Triangles are some of the most popular chart patterns in the market. There are three main types of triangles that you can use to identify breakouts.
First, there are ascending triangles, which are usually signs of a bullish continuation. This pattern is characterized by a flat resistance level and an ascending trendline.
In most cases, the financial asset usually forms a bullish breakout when the two lines near their confluence level.
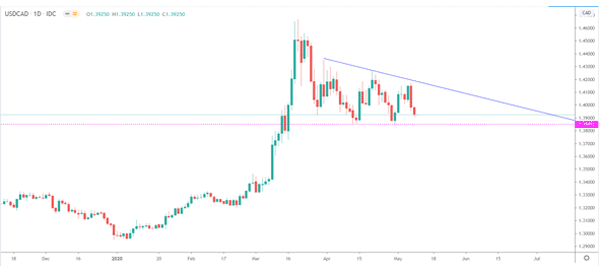
Second, there is a descending triangle pattern that is the exact opposite of an ascending triangle. It forms during a downtrend and is usually characterized by a flat bottom and a descending trendline. In most cases, this pattern usually leads to a bearish breakout.
Finally, there is a symmetrical triangle, which is usually characterized by ascending and descending trendlines that resemble an equilateral triangle. Unlike the two triangles, this one can have a breakout in either direction.
The chart below shows how a descending triangle looks like.
Wedge pattern
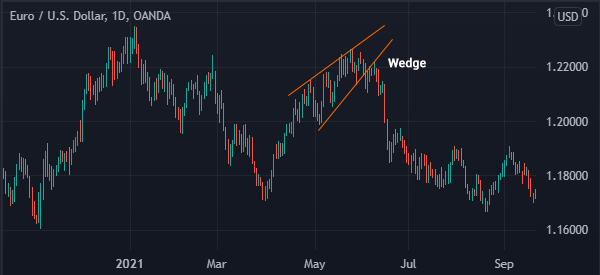
A wedge pattern is another pattern that traders use to identify bullish and bearish breakouts. It is a pattern that is made up of two trendlines that converge. A rising wedge is formed when these lines are rising while a falling one happens when the two lines are in a downward trend.
Wedges are usually signs of a reversal. A rising wedge typically signals that a new bearish trend is about to form. On the other hand, a falling wedge pattern is usually a signal that a new bullish trend is about to form.
These breakouts tend to happen when the two lines are nearing their convergence levels. A good example of a rising wedge is shown below.
Head and shoulders
Head and shoulders is another popular pattern for trading breakouts in the market. It is a pattern that is named because of its resemblance. As the name suggests, the pattern has four key sections: right shoulder, head, left shoulder, and neckline.
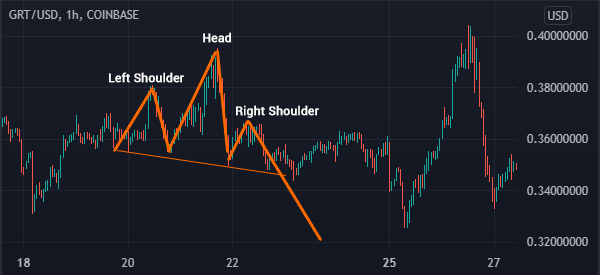
When it forms, it is usually a sign that a bearish breakout is about to happen. In most cases, a bearish breakout usually happens when the price drops below the support level. The target for such a trade is established by measuring the distance between the head and neckline.
The opposite of this pattern is known as the inverse head and shoulders pattern. It usually forms when a financial asset is moving in a downward trend. Similarly, when it forms, a bullish breakout happens when the price moves above the upper neckline.
Cup and handle pattern
Another pattern that is used to trade breakouts. As the name suggests, the pattern resembles a typical cup that has a handle. In most cases, it forms when an asset in an uptrend finds a strong resistance and then moves in a slow downward trend. It then finds a support and starts to rise slowly.
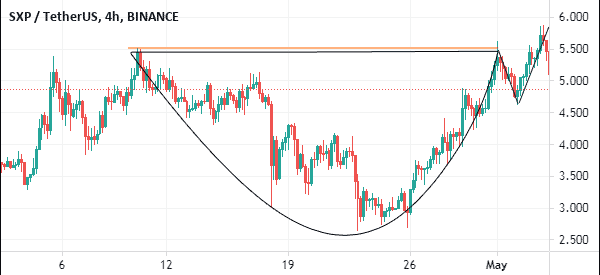
In most cases, the bullish breakout usually forms when the price moves above the initial resistance level. An inverted C&H pattern is usually a sign of bearish continuation.
Rectangles
Further, a rectangle pattern can help you identify a bullish or bearish breakout. It is a pattern that is usually characterized by two horizontal lines. In this situation, the price usually struggles to move below the support and above the resistance.
As a result, the pattern can lead to a bullish or bearish breakout. The best way to trade this pattern is to open pending orders slightly above and below these levels.
In this case, the two pending orders will be triggered when the price moves above and below the rectangle channel.
Summary
We have seen that breakouts are a fundamental part of a trader’s analysis. And to identify these breakouts, the undisputed best way is to rely on chart patterns, as known as price action analysis.
This approach is better than using technical indicators, however these tools can be used to confirm or not confirm the strength of the breakout.
There are other popular patterns that people use to identify breakouts. In this article, we have looked at just a few.
The other important patterns are bullish and bearish flags, bearish and bullish pennants, and double and triple top patterns.
External useful resources
- 7 Steps to follow when Trading Breakout Stocks – ELearnMarkets
