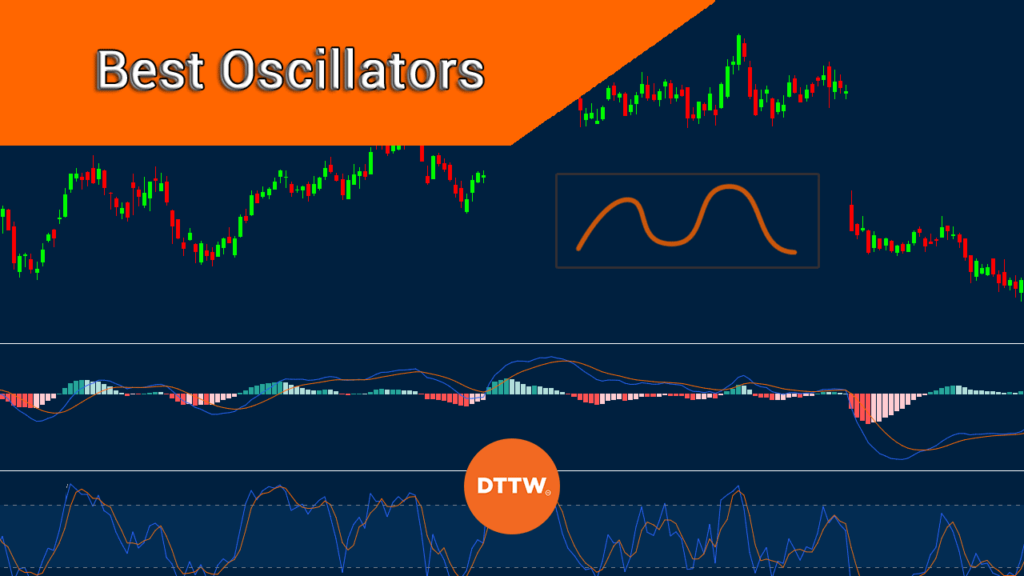
Oscillators are important indicators that help to tell the state or position of a financial asset. As the name suggests, the indicators usually oscillate between a certain point.
In most cases, they are used to identify oversold and overbought levels. Traders also use them to confirm trends. In this article, we will look at some of the best oscillators that you can use in trading.
What oscillators are best for day trading?
MACD
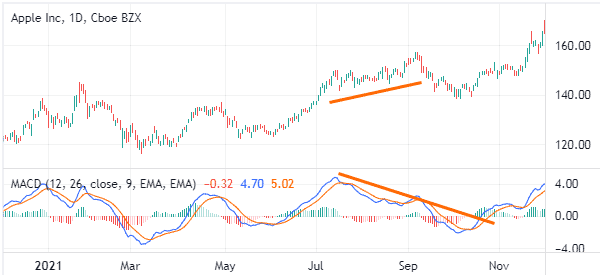
Moving averages are some of the best indicators in the market. Day traders use them mostly in trend following and to identify reversals in the market. The MACD indicator is a tool that converts two moving averages into an oscillator.
It does this by subtracting the longer moving average from the shorter one. In most cases, the shorter moving average is 9 while the longer average is 26. When applied in a chart, the indicator has two flowing lines and a neutral level.
The MACD can be used in various ways. For example, you can use it to trade reversals. This mostly happens when the two moving averages make either a bullish or bearish crossover.
You can also use it to trade divergences. A divergence happens when an asset is rising while the MACD is making slow downward trends.
As stated above, you can also use the MACD in trend-following. In most cases, its price will keep rising as long as the two lines are in an upward trend.
Relative Strength Index (RSI)
The Relative Strength Index (RSI) is one of the most popular oscillators in the market. It is a popular indicator that was developed by J. Welles Wilder, a well known expert who also created other indicators like the Average Directional Index (ADX) and the Average True Range (ATR).
The RSI measures the speed and change of price movements in the financial market. It is calculated by first finding the relative strength of an asset and then adding 1. After that, you divide 100 from the result and then subtract the final figure by 100.
As a trader you can use the RSI in a number of ways. For example, the most popular method of using the indicator is to identify overbought and oversold levels. The baseline overbought level is at 70 while the oversold level is at 30.
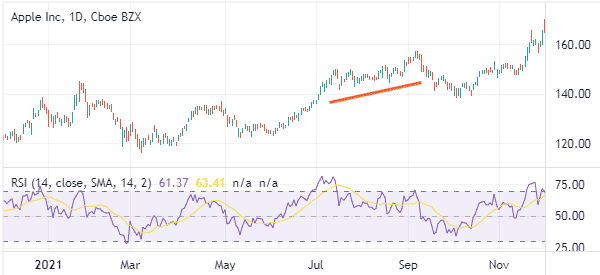
You can also use the RSI in trend-following. In this, the asset’s price will keep rising as long as the RSI is in an upward trend. It will then resume the bearish trend as long as the RSI is falling.
Stochastic Oscillator
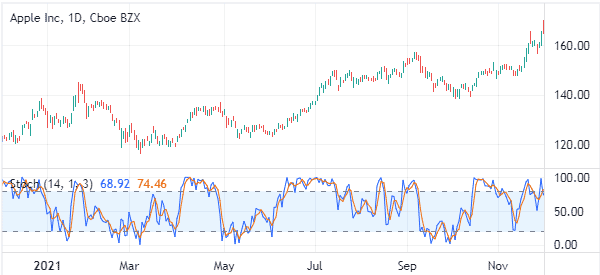
The Stochastic Oscillator is a popular indicator that was developed by George Lane. It normally shows the location of the close relative to the high-low range over a certain period. The indicator has two flowing lines known as %K and %D. It also has overbought and oversold levels at 80 and 20, respectively.
Day traders make the most of the potential of the Stochastic Oscillato mostly when a financial asset is trending or when there is some volatility. Like most oscillators, it is relatively difficult to use it in ranging markets (for range markets we have other strategies).
One way of using the indicator is to buy when it gets extremely oversold and then sell when it gets extremely overbought. You can also use it to find divergences and even reversals.
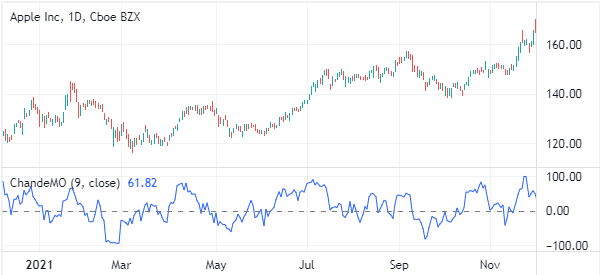
Chande Momentum Oscillator (CM)
The Chande Momentum Oscillator is another relatively popular indicator among traders. It differs from the Relative Strength Index and Stochastic in that it does not have overbought and oversold levels. Instead, it has a neutral line and a flowing one that sends the signal.
The indicator is calculated by getting the difference between the closes and the sum of all recent lower closes. The answer is then divided by the sum of all price movements and then multiplied by 100.
The Chande Momentum Oscillator is used to find when a rally or a bearish trend has been overstretched. You can also use it in trend following since it will mostly keep rising as long as the price is rising. Alternatively, another option is to use it to find divergences.
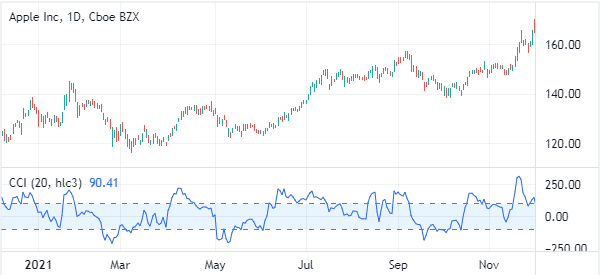
Commodity Channel Index (CCI)
The CCI indicator was developed by Donald Lambert in 1970s. His original focus for the indicator was in the commodity market. Today, you can use the CCI indicator to trade all markets, including bonds and stocks. The indicator is mostly used to find extremes or overbought and oversold levels.
It measures the current price level relative to the average price level over a given period of time. As a result, the CCI is at an elevated level when the price is above its average.
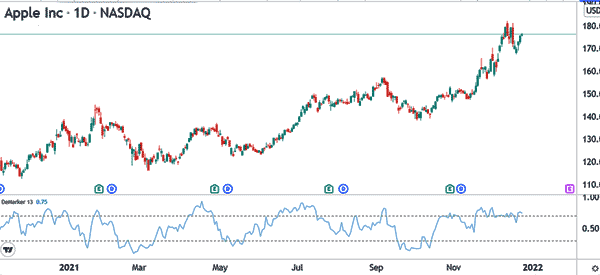
DeMarker Indicator
The DeMarker indicator was developed by Tom DeMark in 1970s. Its calculation is relatively different from other indicators.
For one, it does not concern itself with the closing price of an asset. Instead, it focuses on the intra-period highs and lows. It looks at the high and low of the current bar on a chart and how they compare from those of the previous bar.
The indicator has a close resemblance to the Relative Strength Index (RSI) in that it has a line and overbought and oversold levels. As a trader you can use it in a similar way to the RSI.
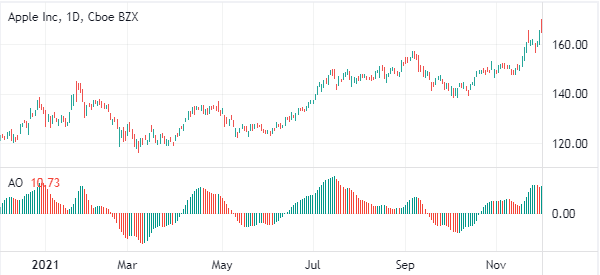
Awesome Oscillator
The Awesome Oscillator (AO) is a popular indicator that compares recent market movements to historic market movements. It has a neutral level and a series of green and red bars. Green bars show that the price is rising while the red bars show that the price is falling.
The indicator is calculated by looking at the 34-period simple moving average of the median prices. It is then subtracted from a five-period SMA of median prices.
Summary: include oscillators in your strategy!
Oscillators are important indicators that are used by day traders and long-term investors. Our suggestion is to use these indicators with other indicators like moving averages and Bollinger Bands to fully exploit their potential and avoid wrong signals.
In this article, we have looked at some of these indicators and the situations where they can perform best.
External Useful Resources
- How to Use Oscillators to Warn You of the End of a Trend – Babypips
