Momentum indicators are important in the market as they provide more information about the state of financial assets.
For starters, momentum is defined as the force or speed of an object in motion. It can also be defined as the strength or force gained by motion or by a series of events. In trading, momentum measures the speed of price changes relative to actual price levels.
In this article, we will look at what momentum indicators are and then identified some of the most popular of them.
What are momentum indicators?
Momentum indicators are defined as those that are used to determine the strength and weakness of a stock or another financial asset. As the definition above shows, these indicators are used to measure the rate of the rise or fall of an asset.
There are other types of momentum indicators. First, there are trend indicators that are used to determine whether an asset is moving in a specific trend and whether it wants to diverge. Examples of the most popular trend indicators are moving averages and Bollinger Bands.
Second, there are volume indicators, which are focused on showing the overall trends in volume in an asset. These are important indicators because of the significant role that volume plays in the financial market.
Some of the most important types of volume indicators are the accumulation and distribution, Volume Weighted Average Price (VWAP), and volume-weighted moving average (VWMA).
How to read momentum indicators
There are two main types of moving averages in terms of how to read them. First, there are those momentum oscillators that seek to identify the overbought and oversold levels.
An overbought level is where an asset has rallied so much and become overvalued in technical terms. On the other hand, an oversold level is where it has dropped sharply and become undervalued.
Examples of these indicators are the Relative Strength Index (RSI) and the Stochastic Oscillator.
Second, there are momentum oscillators that have a zero point. A move above the zero point is seen a confirmation that the bullish momentum will continue. A good example of this indicator is the MACD.
Related » How to Use Momentum Trading Strategies Profitably
Types of momentum indicators
There are three main types of momentum indicators that you will find in the market. As you will find out, some of these indicators don’t fall in these three categories.
Related » Pro Strategy: Find the Strongest Momentum Stocks!
Closing price compared to the previous one
First, there are momentum indicators where the closing price of an asset is compared with the previous one. The idea is that if an asset’s price keeps closing above the previous close, it has a bullish momentum.
As such, these indicators seek to identify whether an asset is in an overbought or oversold level. Examples of these indicators are the Relative Strength Index (RSI) and the Rate of Change (ROC).
Closing price compared to range
Second, there are indicators that seek to identify the closing price of an asset compared to a range. In other words, these indicators look at how an asset’s price is trading in relation to how it has performed in a certain period of time.
They look to explain whether the market is strong or weaker compared to historical performance. They include the commodity channel index (CCI) and the Stochastic Momentum Index (SMI).
Closing price compared to MA
Finally, there are those that seek to compare the closing price with to the moving average. The idea is to look at whether an asset is trading sharply above or below a specific moving average. A good example of this is the Moving Average Convergence Divergence (MACD).
Best momentum oscillators
There are many momentum oscillators in the market. Now we will go together to look at the most popular ones, with which you will doubtless be familiar. If this is not the case, you can always catch up with our tool-specific guides.
Relative Strength Index (RSI)
The RSI is one of the most popular indicators in the market. It was developed by Welles Wilder, a technician who has also developed several other indicators like the Average True Range (ATR) and the Average Directional Index (ADX).
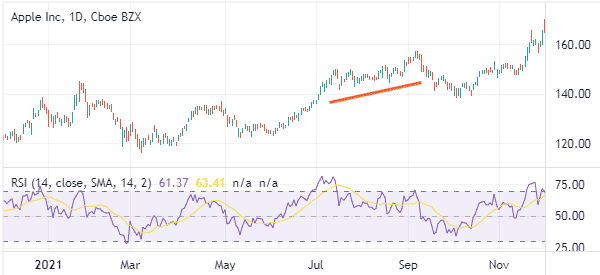
The RSI measures the speed and change of price movements of an asset. It oscillates between zero and 100. A move above 70 is said to be an overbought level while a drop below 30 is a sign that the asset has become extremely oversold.
Squeeze Momentum Oscillator (SMI)
This is an indicator that was created by John Carter. It was developed by combining Bollinger Bands and the Keltner Channel.
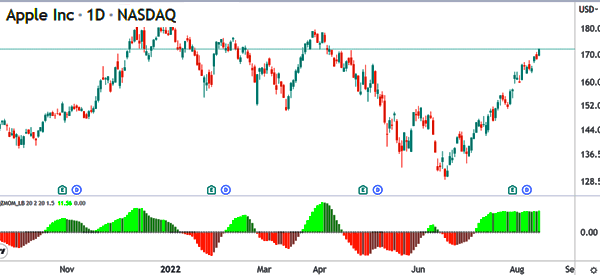
The squeeze momentum shows when the momentum increases and decreases. It consolidates near the zero line when there is no volatility and rises when volatility escalates. The chart below shows the SMI indicator applied on the Apple chart.
MACD
The moving average convergence divergence (MACD) is an indicator that was developed by converting moving averages into an oscillator.
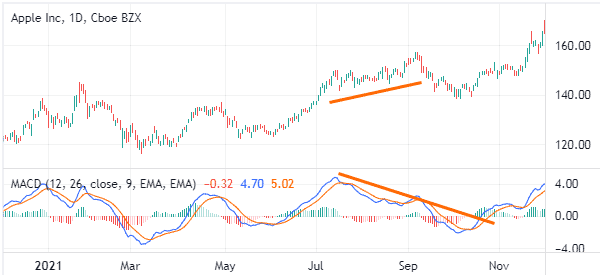
The MACD has a neutral line and is ideal in showing an asset’s trend and its momentum. More bullish momentum emerges when an asset’s price moves above the neutral point going upwards and vice versa.
Related » What is a Convergence in Trading?
The MACD line is calculated by subtracting the 26-day MA from the 12-day EMA. The signal line is the 9-day EMA of the MACD line.
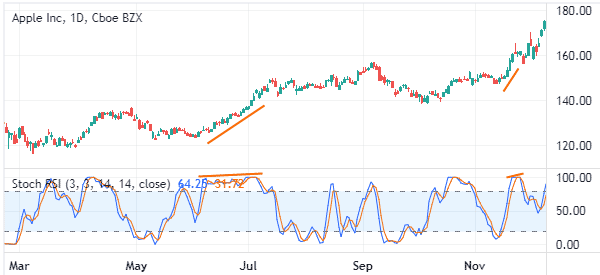
Stochastic Oscillator
The Stochastic Oscillator was created by George Lane. It is an oscillator that shows the location of the close relative to the high-low range over a certain period of time.
The indicator does not follow the price and volume. Instead, it follows the speed or the momentum of the price. The indicator is useful in that it shows the overbought and oversold levels as shown below.
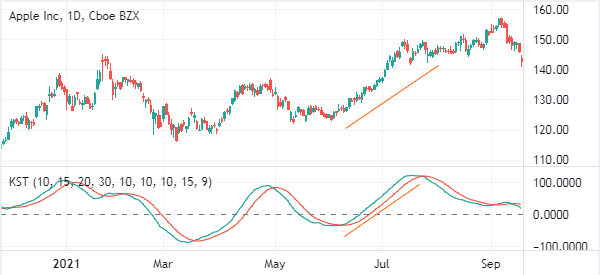
Know Sure Thing
Know Sure Thing (KST) is a popular indicator that was created by Martin Pring. It is based on the smoothed rate-of-change for four different timeframes.
It has two lines and a zero line. A bullish momentum is confirmed when the price moves above the neutral point.
Summary
In this article, we have looked at what momentum indicators are and how they work. We have also looked at some of the top momentum indicators and some of the top strategies to use.
These are not the only indicators we can use to identify momentum. Yet it is worth mentioning more tools such as the ADX, the Rate of Change and the Momentum indicator.
External useful resources
- Averaging Momentum Indicators. Do They Add Anything in Trading? – Medium
