As a trader if you watch or read financial news regularly, you have most definitely heard commentators talk about the yield curve. It is one of the most common terms in the market every year as the market conditions change.
Meaning of yield curve
Yield curve is an important term in the financial market that refers to the arrangement of bonds of different maturities. In a normal market, the yield of a 2-year bond should be lower than that of ten years. Besides, investors will demand a better interest for lending money for a long time.
If the yield of a shorter-term bond is better than that of the longer one, most people will opt for shorter-term bonds.
This article will explain more about the yield curve and why it matters to traders. We will also look at the three types of yield curves: normal, inverted and flat.
- Normal yield curve – This happens when shorter bonds have a lower yield than longer-dated ones.
- Inverted yield curve – It happens when longer bonds have a lower yield than shorter ones.
- Flat yield curve – This is when longer and shorter bonds have a similar yield.
What is the Bond Market
The yield curve starts from the bond market. A bond is the amount of money that individuals and investors give to companies, municipals, and governments. To these entities, a bond is the cheapest and easiest way to raise money.
In other words, government borrows money from investors which it uses to fund its projects.
The United States is the biggest issuer of bonds, which the country uses to fund development. The government bond market has soared in recent years. In particular, the overall treasury market has risen to more than $20 trillion.
These bonds have different expiration periods. In general, shorter-dated bonds tend to have a lower yield than longer ones because they usually have fewer risks. For one, it is easy to predict what will happen in the next one month or in the next 10 years.
Therefore, a normal yield curve usually slopes upwards from left to right because maturities lengthen and yields rise.
Yield Curve and Bonds
In a bond, you fund these entities and then receive interest at certain periods (this period ranges from one year to 30 years). You will then receive the principal amount when the bond matures.
In a normal situation, shorter-term bonds attract lower interest because the short duration is more certain. The longer-dated bonds attract a higher interest rate because investors need a higher return for tying up the money for longer periods of time.
Therefore, when the shorter term and longer-term bonds are plotted, the chart moves from low to high.
The Yield Curve inversion
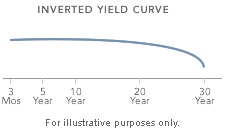
When there is the inversion of the yield curve, the opposite happens. This is when the shorter-term treasuries yield higher returns than longer-term treasuries. The chart below shows how an inverted curve looks like.
In it, we see that shorter-term bonds have a higher yield than the longer-term ones. This happens when bond traders believe that there will be more risks in the short-term than in the long-term.
The yield curve is simply the spread of the longer-term bonds and shorter-term bonds. The most common periods are ten years and two years.
When the economy is doing well, investors tend to get concerned about inflation and higher interest rates. Therefore, they require more yields from longer-term bonds.
When the Federal Reserve raises rates, the short-term yields rise in relative to the long-term yields as inflation expectations rise. The problem comes when the Fed tightens very fast and causes the short-term rates to rise above the long-term yields.
The worry among investors is that all the seven past recessions came at a time when the yield curve had inverted. That is, when it moves below the zero line.
Therefore, since it is always difficult to predict when a recession will take place, investors use data such as this to predict when it will happen.
A normal and inverted yield curve are the most common in the market. However, at times, the curve could be flat. A flat curve tends to come just before the inverted one.
It usually happens when the yields on the short-term bonds are equal to those of long-term bonds.
How to Read the Yield Curve
- First, not all the inversions have lead to a recession in the past.
- Second, when it happens, there is usually a lag time between the inversion and the recession. In the past, it takes between 6 months and 2 and a half years for a recession to lead to an inversion.
- Third, the predictive power of the slope has not always been an effective curve indicator.
- Fourth, the inversion does not lead to a recession. Instead, an inverted yield curve worries investors because it tells them the expectations about the economy.
- Finally, the yield curve is one of the many market factors that could point to a recession. The others include for example the jobless claims, consumer spending and capital investments.
› Why the Jobs Reports Matter and How to Trade Them
How to trade the yield curve
There are two main ways of trading the yield curve. First, you can use it if you are a bond trader. In this, you directly buy and sell bonds to take advantage of their movement. This is not a common approach by most day traders because many brokers don’t offer bonds.
Second, the most common approach is to use the curve as a pointer of what will come in the future. In most cases, stocks tend to slump when the yield curve inverts.
For example, it inverted in 2019 leading to a major decline in stocks in 2020 amid the pandemic. Therefore, stocks will tend to decline sharply immediately when the curve inverts and then rapidly rise as traders digest the happenings.
Therefore, you should use the latter option as a mere guide.
Riding the yield curve
One of the most common strategies to use when trading the yield curve is to ride the curve. This strategy is mostly common among large traders who have access to bonds in their platforms.
Riding the yield curve is the process of buying and selling long-term bonds before they mature. The benefit of doing this is that you will benefit as the yield falls near to the bond’s maturity. For one, a 10-year bond today will have a better yield than in the next five years. This strategy works well when there is a normal market environment.
Rolling down in yield curve
This is another strategy that one can use to trade the yield curve. As mentioned above, a bond holder can calculate the overall return by looking at yield to maturity or the current yield.
Yield to maturity is the overall yield they will earn if they hold it to maturity. Current yield is what they are earning now. The roll-down strategy depends on the shape of the yield curve. It involves selling a bond as it nears its maturity rate.
Implications for traders
Day traders can use the yield curve to determine whether to buy or sell some assets. For example, if the yield of a two-year bond is rising, it can mean that investors expect that the Fed will hike interest rates. As a result, this means that they can buy the US dollar and short stocks.
External Useful Resources
- Yield Curve Shifts Create Trading Opportunities – CME Group
