Technical indicators are useful tools that can tell you when to buy or sell an asset like a stock, commodity, or Exchange-Traded Fund (ETF). These indicators are created through mathematical calculations.
While there are many indicators, most of which we have covered, not all of them are useful for pointing buy and sell zones. In this article, we will look at some of the top buy and sell indicators that are used by day traders.
Volume-Weighted Average Price (VWAP)
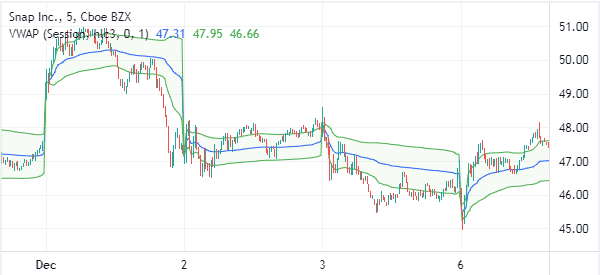
VWAP is one of the most common indicators in the market. It is mostly used by day traders rather than long-term investors. As the name suggests, VWAP identifies the volume of an indicator by its weighting.
It is calculated using a relatively simple method. First, you need to calculate the typical price of the period. This is done by adding the high, low, and close and then dividing by 3. Second, you multiply the typical price by the volume of the same period.
Next, you calculate a running total of these numbers. This is known as a cumulative total. You should then calculate the running total of volume and then divide the running total of price and the running volume,
The VWAP is best applied to a chart that about 5 minutes or less. For example, you can identify buying and selling signals by looking at when the price moves below or above the VWAP. If the price moves above the VWAP, a bullish trigger is usually triggered and vice versa. You can see this in the chart below.
Moving Average
The Moving Average is an important technical indicator in the market today. There are several types of moving averages. They include the weighted, simple, exponential, and smoothed among others.
The moving average attempts to look at the average price of an asset in a certain period. For example, a simple MA of a 10-day period represents the average price where the stock was in that period.
The other types of averages usually remove the noise. For example, the EMA removes this noise by putting more emphasis on the latest data. For example, it assumes that yesterday’s data are better than those of the previous week.
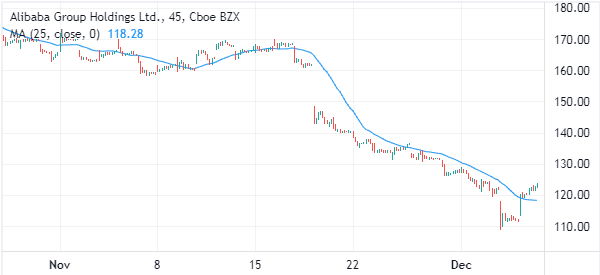
When used well, moving averages can tell you when to buy or sell a stock. For example, in the chart below, since Alibaba’s share price is below the moving average, it means that people should continue selling the stock. A bullish signal will emerge when the stock moves above the moving average.
Bollinger Bands
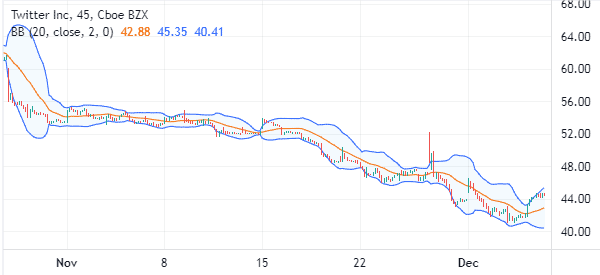
Bollinger Bands is an indicator made up of three lines. The middle line is usually a moving average of the asset. The upper and lower bands are the standard deviations. When used well, the Bollinger Bands can tell you when to buy and when to sell a stock.
Many day traders maintain a bearish trend when the price is between the middle and lower band. In this case, a signal to exit a short trade is when the price crosses the middle line.
Similarly, a buy trade emerges when the price moves above the middle line and keeps rising. Bollinger Bands can also show you support and resistance levels. This is shown in Twitter’s stock below.
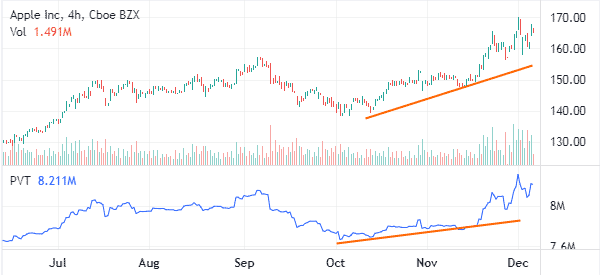
Volume indicator
Volume is an important concept in the financial market. The volume indicator shows the overall volume flows in the stock. When applied in a chart, the indicator has red and green bars. Red refers to bearish bars while green represents a bullish bar.
A good way to see about it is to use an indicator known as the volume price trend. This is an indicator that provides the trends in volume using a line. In the chart below, we see that the trend is bullish when the Apple share price is rising. Therefore, when you see the trend falling, it is a sign to exit the bullish trend.
There are other ways to use volume in day trading. One way is to incorporate other volume indicators like accumulation and distribution and money flow index. Most importantly, if you have access to time and sales, this data will help you see the movement of real orders in the market.
Summary
Traders use different indicators to find buy and sell signals. In this article, We have highlighted some of the best indicators to use. Some of the other popular ones that we have excluded are parabolic SAR and Ichimoku Kinko Hyo
External Useful Resources
- Savvy stock traders use these 2 insider tips to know when to buy and sell – Marketwatch
