Channels are an important concept used by most traders and investors. They provide an excellent way to identify potential entry and exit points. They are also useful in identifying areas of potential breakout.
In this article, we will look at what channels are and some of the top strategies of using them.
What are channels?
As the name suggests, a channel happens when the price of an asset is having a series of parallel support and resistance levels. A support is best defined as a floor where the price struggles to move below while a resistance is seen as a ceiling where it struggles to move above.
There are several benefits of using channels in the market.
- Mood of the market – Looking at a channel can help you identify the mood of the market. A narrow channel tells you that a financial asset is in a consolidation mode. A wide channel, on the other hand, tells you that there are some volatility in the market.
- Breakout zone – A channel can help you identify a good area of breakout in the market because the pattern does not remain in that range forever.
- Accurate – While no trading strategy is 100% accurate, when used well, channels can be relatively accurate for day traders.
- Easy to use – As you will see below, channels are relatively easy to draw and use in the financial market.
Types of channels in trading
Broadly, there are three main types (but four in total) of channels in the market. First, there are horizontal channels that form when the support and resistance levels are parallel to one another in a horizontal direction. Second, there are ascending channels that form when the parallel lines are tilting upwards.
Third, there are descending channels that happen when the overall channel is moving downwards. Finally, there are widening channels that form when the resistance line is rising while the support line is falling. The chart below shows a good example of an ascending channel.
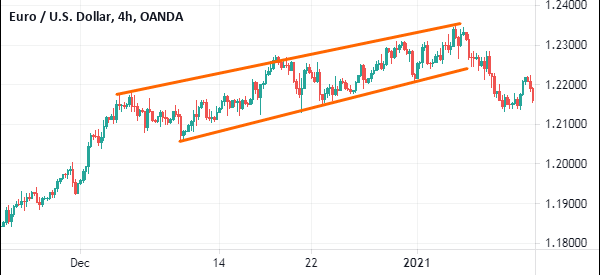
ascending channel example
How to draw them
As mentioned above, channels are relatively easy to draw. There are two main approaches to draw them. First, you need to look at a chart visually and see whether there is a channel.
Second, you need to use the freely provided tools to draw this channel. Trading View provides several tools to help you achieve this (but you could do it also in our PPro8, sure). As shown below, some of these tools are the Trend Line, Info Line, Trend Angle, Horizontal Line, and Horizontal Ray, among others.
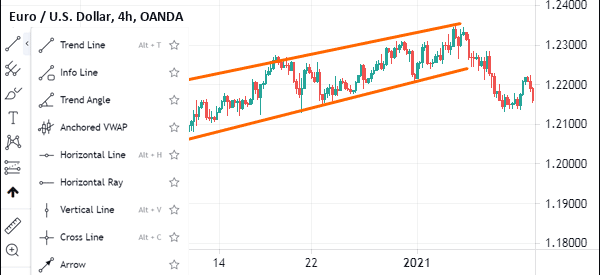
Third, you need to select the tool you want to use and then draw the channel. You should start by drawing the resistance line and then the support line, or vice versa. Ensure that each of these lines touches several key levels.
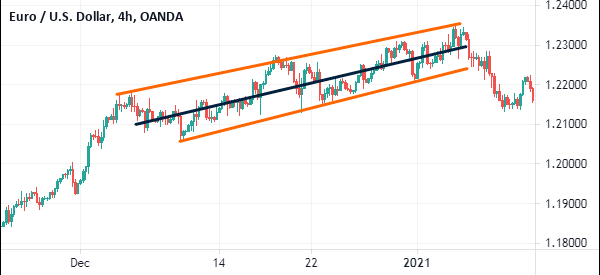
As shown above, there are other types of channels that are also relatively popular. For example, there is the regression trend that has three lines. It has a support and resistance level and another middle line. The chart below shows the same chart above with a regression trendline.
The other popular types of channels are disjoint channels and flat-top channels.
How to trade with channels
There are several strategies of trading channels in the market. The first step is what we have done above, in that we have identified and draw the channels.
One of the most effective channel trading strategies is to use pending orders. A pending order is one that is only opened when the price reaches the certain level. There are several types of these orders, including:
- Buy stop – In a buy stop, you direct the broker to open a buy trade above the current level. For example, if a stock is trading at $10, you can have a buy stop at $12.
- Sell-stop – A sell-stop is where you direct the broker to open a sell-trade below the current level. In the example above, you could set a sell-stop at $8.
- Buy limit – This is where you direct a broker to initiate a buy trade below the current level.
- Sell limit – It is where you direct a broker to open a sell trade above the current level.
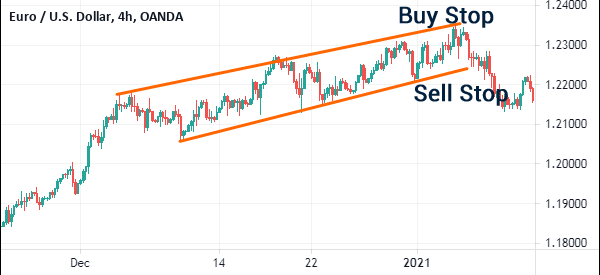
Therefore, in a channel, you can open a buy stop above the resistance level and set a sell-stop below the channel. The idea is that if the price breaks out higher, the buy trade will be initiated. Similarly, if the price breaks out lower, the sell trade will be initiated. These trades should be accompanied by a take-profit and a stop-loss.
A good example of this is shown in the chart below. As seen, the trader has a buy stop and a sell stop. In this case, it is the sell-stop that was triggered while the buy stop remained intact.
Best indicators
There are other types of channels that we have not mentioned above. These are channels that are formed using indicators. Fortunately, we have looked at some of these channels before. The most popular ones are:
- Bollinger Bands – There are channels created using moving averages and standard deviation. The middle line is usually a certain period’s moving average while the upper and lower lines are the standard deviations.
- Donchian channels – These are channels where the upper and lower lines represent the top-most and lower-most levels during a certain period while the middle line is the average of the two.
- Keltner channels – Keltner channels are similar to Bollinger Bands. The only difference is that they use the Average True Range (ATR) instead of the standard deviation.
- Fibonacci channels – These are channels that happen between two Fibonacci levels like between the 38.2% and 50% retracement levels.
Summary
Channels are effective tools used by many traders in the market. In this article, we have looked at what the channels are, how to draw them, and some of the strategies to use when using them to trade.
External useful Resources
- 4 Effective ways to trade a channel – Trading Setup Review
