Chart analysis plays an important part in day trading and long-term investors. It is a process where a person looks at charts with the goal of studying trends and predicting trends.
While it is possible to trade without charts, most people find using them to be better. We also recommend relying on this tool, because it makes your work in the financial markets much easier.
In this article, we will look at what a trading chart is, types of charts, and identify the most popular types of charts in day trading.
Types of charts in day trading
There are several types of charts in day trading. In most cases, these charts show the overall movement of an asset price over time. By looking at them, one can tell whether an asset is trending or ranging. Also, one can predict whether an asset price will rise or fall.
- Candlestick chart – This is the most popular type of chart in trading because it shows the open, close, high, and low.
- Line chart – This chart connects the close or open price over time. It is not commonly used in day trading.
- Bar chart – The chart has a close resemblance to candlesticks in that they show OHLC.
The other popular types of charts in the analysis are: renko, area, heikin ashi, kagi, point & figure, and range among others.
Types of analysis in charts
There are several types of analysis when using charts. In most cases, all these types are known as technical analysis. Some rely on technical tools to identify the best entry and exit points from a trade, while others focus more on identifying visual patterns.
Technical indicators
First, there is an analysis type that focuses on technical indicators like moving averages, Relative Strength Index (RSI) and Bollinger Bands.
The focus of these indicators may vary, depending on what we want to measure. Some analyze the volume, others volatility, some serve to identify crossovers. These are just examples; actually, there are indicators for every need.
Trend indicators
Second, there is trend-following analysis, which traders use to determine whether a trend will continue or reverse. Traders use several strategies to determine this.
For example, they use tools like Fibonacci Retracement, and Andrews Pitchfork. Others use trend indicators like moving averages to determine the trend.
Patterns
Third, there is price action analysis, which involves doing chart and candlestick analysis to identify reversals and continuation chances. This time with the help of visual analysis and drawing tools you can commonly find in the softwares.
Some of the top patterns you can use are triangles, head and shoulders, doji, and rising wedge.
How trading charts work
Trading charts simply provide a full suite of products and tools that people use to conduct analysis and execute trades. Some of the most popular tools that are provided by these platforms are:
- Technical indicators – These are tools, created using mathematical calculations, that help traders to forecast an asset’s price action. Examples of top technical indicators are moving averages, relative strength index, and MACD.
- Symbols – A trading chart has a feature where you can look for financial assets like currency pairs, commodities, stocks, and ETFs.
- Drawing tools – Trading charts have a suite of drawing tools that traders use to draw on charts for analysis purposes. Some of the top drawing tools found in charts are trendlines, information lines, horizontal, and regression lines among others.
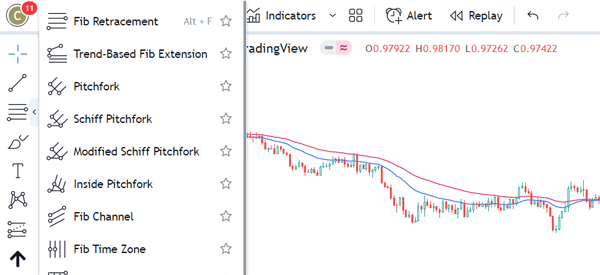
- Charting tools – Trading charts have charting tools that traders use in their analysis. Some of the most common charting tools are Fibonacci Retracement, Pitchfan, Gann Box, and Gann Square among others.
The chart below shows a chart pattern with some of those tools.
Examples of trading chart providers
There are many trading charts. The most commonly used ones are:
- MetaTrader 4 and 5 – The MT4 and MT5 are the most popular chart patterns around. They are mostly provided by companies in the forex and CFD industries.
- TradingView – TradingView is another popular type of charts. It has thousands of financial assets and loads of tools.
- NinjaTrader – NinjaTrader is another popular trading chart that has many tools to trade such as indicators and drawing tools.
- PPro8 – This is the trading software provided by Real Trading. It is one of the most advanced products that has all tools that a trader needs to make decisions.
What charts do professional traders use?
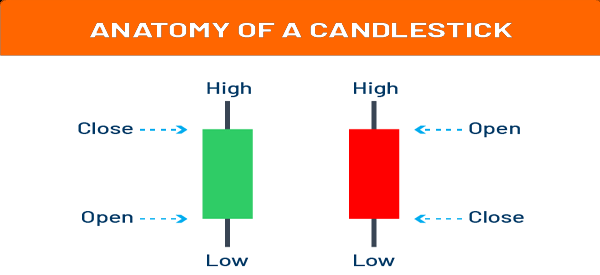
A common question is on the popular types of charts that professional traders use. In most cases, based on our experience, most professional traders prefer using candlesticks in trading. A candlestick is a chart pattern that has clear-to-see open, high, low, and high prices. The chart below shows the bullish and bearish candlesticks.
On the left side, there is a bullish candlestick that is shown in green. In an hourly chart, the single candlestick usually represents a single hour. Similarly, in a daily chart, a single bar represents a day.
A candlestick is made up of a body and an upper and lower shadow. The shadows show the highest and lowest points while the body shows the open and closing prices.
Advantages of candlestick patterns
There are several reasons why candlesticks are the best trading charts.
- More data – Unlike a line chart, a candlestick provides all data that a trader needs, including the open, high, close, and low.
- Can be used with indicators – Candlestick patterns can be used well with indicators like moving averages and the RSI.
- Easy to understand – Candlestick charts are easy to understand. For example, in a hourly chart with more green candles, it means that the price is in a strong bullish trend.
- Can be used with algorithms – Candlesticks can be used with algorithms since they are easy to use.
- Many candlestick patterns exist – Another advantage is that there are many candlestick patterns that can help you make decisions.
Disadvantages of candlesticks
There are not many disadvantages of using candlesticks. First, at times, candlestick charts can have huge gaps, which are not all that easy to trade with.
Second, at times, chart patterns can provide too much information. For example, a chart can be forming a double-top pattern and also an ascending triangle at the same time.
Summary
By now, you should have understood: although it is possible to trade without using charts, they are one of the most powerful tool for your analysis.
You should also have realized that your efforts, initially, need to focus on candlesticks because you will use them 99% of the time.
External useful resources
- How to read a trading chart – Avatrade
