Technical analysis is an important concept in trading. It involves using mathematical models and tools to predict the next price movements of an asset.
As we have looked at before, there are different types of technical indicators, including volume and trend. In this article, we will look at indicators known as oscillators and explain what they are.
What are oscillators?
The term oscillators comes from the word oscillate. Cambridge dictionary defines the term oscillate as to move repeatedly from one position to another. In technical analysis, oscillators refer to indicators that create low and high bands of extreme levels.
These bands are then used to find overbought and oversold levels. An overbought level is the technical version of an asset being overvalued while an oversold level is when it is undervalued.
The idea behind oscillators is that the price will start attracting fewer buyers when it moves into an overbought level and vice versa. As a result, oscillators are also known as momentum indicators.
How they work
There are different types of oscillators in the financial market. Broadly, the concept behind oscillators is that there are two bands where they oscillate.
For the Relative Strength Index (RSI), the bands can be between 70 and 30. Other oscillator like stochastic and commodity channel index (CCI) have their separate bands (but none can fluctuate outside a range of 0-100).
Oscillators mostly use the concept known as rate of change. In this case, when an asset’s price rises, the rate of change increases and the price rises as well. As such, when the rate of change starts slowing down, it is usually a sign that the momentum is slowing and that a reversal is imminent.
These indicators are calculated using different approaches. For example, the RSI is calculated by comparing the average price change of the advancing periods with the average change of the declining periods.
What are oscillators used for? Some strategies
Oscillators have numerous roles in day trading. Let’s dive into some of the most popular ones.
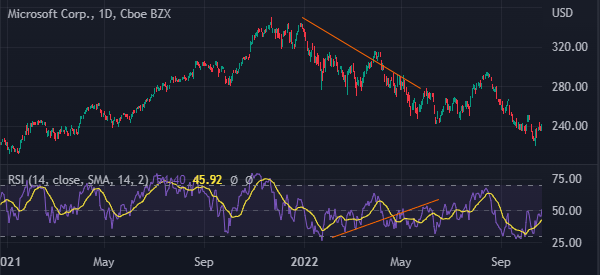
To find divergences
A divergence is defined as a period when an asset’s price is going in the opposite direction with the oscillator. In most periods, that divergence happens when a reversal is about to happen.
If a price is rising and an oscillator is moving in a downward manner, then it means that a divergence has happened. A good example of divergences in trading is shown below.
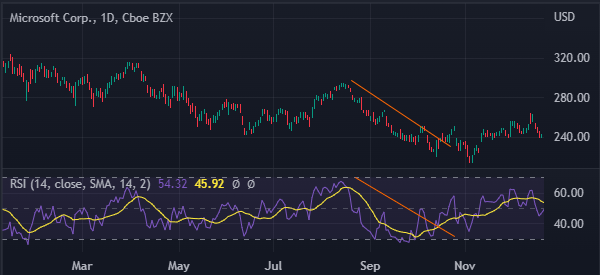
Trend following
Oscillators are also used in trend following. Trend following is a situation where investors buy assets when they are moving upwards and then short when they are falling.
While trend indicators are the most useful in trend-following, it is possible to use oscillators in them as well. This happens because, in most periods, a price rises when the oscillator is rising as well. A good example of this is shown in the chart below.
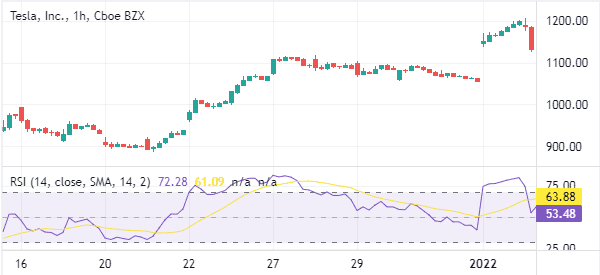
One of the trend-following or momentum strategies when using oscillators is to buy even when the asset moves into an overbought level and short when it moves to an oversold level.
Find overbought and oversold levels
The most important use of oscillators is to find overbought and oversold levels. As mentioned above, an overbought level is where the asset’s price becomes sort of overvalued while oversold is where it is a bit undervalued. An overbought level can signal that it is a good time to exit a bullish trade and vice versa.
For example, in a period when an asset is rallying, moving into an overbought level usually signals to buyers that time is ripe to exit the trade.
In most cases, these oscillators have bands that range from 0 to 100. An overbought level is when it moves above a level like 70 while an oversold is when it moves below a separate band like 30.
Confirm trend indicators
The other approach for using oscillators is to confirm the signals sent by trend indicators like Bollinger Bands and moving averages.
For example, one way of using moving averages is known as a golden cross, which happens when the 200-day and 50-day moving averages make a bullish crossover. In this period, a trader can use an oscillator to confirm that a new trend is emerging.
Best oscillators to use in trading
There are hundreds of oscillators in trading. Here are some of the best ones to use.
Relative Strength Index (RSI)
This is the most popular technical indicator in the market that was created by Welles Wilder. The RSI, as explained above, measures the speed and change of price movements.
It normally oscillates between 0 and 100, with 70 and 30 being the overbought and oversold levels. The RSI can be used in trend-following, finding divergences, and finding overbought and oversold levels.
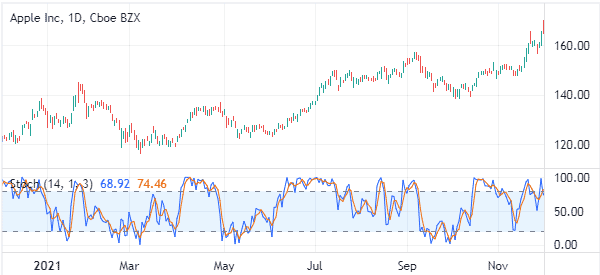
Stochastic Oscillator
The stochastic oscillator is another popular oscillator used today. It was developed by George Lane and is also used to identify overbought and oversold levels.
Unlike other oscillators, this indicator does not follow the price or volume. Instead, it follows the speed or the momentum of change. In most cases, the stochastic oscillator’s overbought and oversold levels are at 80 and 20, respectively.
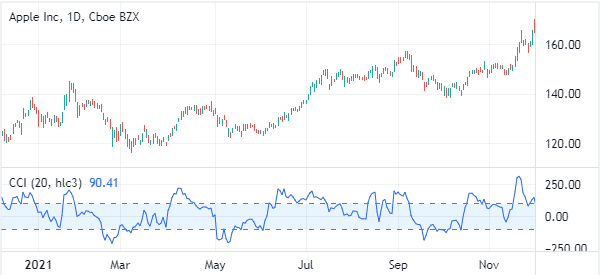
Commodity Channel Index (CCI)
The CCI index is another oscillator that was created by Donald Lambert to identify cyclic turns in commodities.
It is now used to identify overbought and oversold levels across all assets like stocks, currencies, and crypto. The indicator measures the current price level relative to an average price over a certain period.
There are other popular oscillators in trading, including money flow index (MFI), klinger oscillator, awesome oscillator, ultimate oscillator, and chande momentum oscillator among others.
How to use oscillators well
There are a few things you need to do to use oscillators well. First, always conduct a multi-timeframe analysis, which is a strategy where a trader looks at various timeframes.
As you will find out, an asset can be in an oversold level in the daily chart and be at the neutral point in the hourly chart. Therefore, doing this kind of analysis will help you to filter the noise.
Second, focus on just a few oscillators. Since there are many oscillators out there, you should always focus on one or two per chart. Using too many of them will cloud your judgent about the situation. As such, be a master of one or two oscillators.
Third, always consider the broad state of the market. If the market is in a broader sell-off consider shorting stocks and vice versa.
Pros and cons of oscillators
There are several pros and cons of using oscillators. First, these indicators are ideal at identifying market extremes. When used well, oscillators can act as a warning sign that a trend has gone too far and too fast.
Second, they are great at being combined with other types of indicators like trend-ones such as moving averages and Bollinger Bands. Third, they are easy to use.
The main cons is that these indicators can often give the wrong signals. It is common for them to signal a buy opportunity and a stock continues falling. Another con is that many of them are suitable for investors and not day traders.
Summary
In this article, we have looked at what oscillators are and how they work. We have also identified some of the most popular oscillators in the market, including the Relative Strength Index (RSI), Commodity Channel Index (CCI), and Stochastic Oscillator.
External useful resources
- How to Use Oscillators to Warn You of the End of a Trend – Babypips
