Trend following (or trend trading) is one of the most popular day trading strategies in the market. It is also popular among novices because of its (relative) ease of application.
As the name suggests, it involves identifying a trend that has already formed and then following it. It is a relatively different strategy from the reversal strategy that hopes to identify points where reversals take place.
In this article, we will look at some of the best strategies you can use in day trading to follow a trend.
What is trend following?
For starters, a trend is a situation where the price of an asset is moving upwards or downwards for a certain amount of time. For example, if a stock moves from $10 in January to $15 in February and to $18 in March, it can be said to be in a bullish trend. Similarly, if it moves from $10 to $8 to $5 in this period, the stock is in a bearish trend.
On the other hand, if the price hovers in a certain range, this is not a trend but a consolidation phase.
Therefore, trend following is the basic strategy of identifying an asset whose price is moving either upwards or downwards and following the trend.
Traders follow this trend until a time when they sense that the trend is ending. If a bullish trend ends and a bearish one starts, they will short it and make a profit as it slides.
Trend Trading can be a highly profitable trade when used well. However, it also poses some risks, especially to new traders, like We will explain below.
Momentum vs trend-trading
A common question is whether there is a difference between trend and momentum trading. While the two are similar, they have some differences.
As mentioned, trend trading is an approach where a person buys when an asset is rising or falling. The goal is to ride an existing trend to the end.
Momentum is defined as the speed or velocity of an asset price move. In this case, traders or investors buy assets that are having a good momentum.
For example, during the meme stock era in 2021, companies like GameStop, AMC, and Bed Bath & Beyond had strong momentum, which made them strong momentum plays.
Therefore, momentum trading opportunities can happen when an asset is not in a bullish trend in the first place.
Reversal vs trend trading
Another common question is on the differences between a reversal and trend trading. These two approaches have a simple difference. In trend-following, the goal is to buy an asset that is in an uptrend or downtrend. This means that the pattern should be established in the first place.
A reversal, on the other hand, is an approach that aims to enter a trade when an asset is about to change direction. Reversal traders then become trend-followers since their aim is to ride the existing trend until it ends.
These traders use several approaches, including patterns like double-top and double-bottom and candlestick patterns like hammer and doji.
The similarity of reversals and trend traders is that they both look to take advantage of trends.
Breakout vs trend trading
As described above, trend trading is an approach that benefits from an existing trend. The goal is to buy an asset and hold it as it rises or sell one that is in a downtrend.
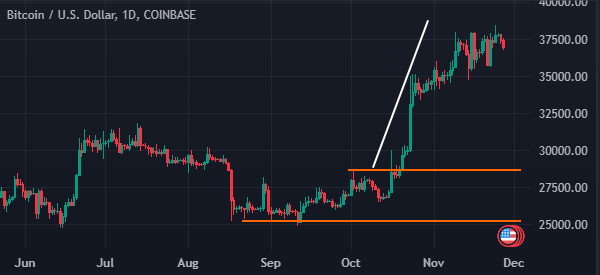
A breakout approach is a different one because of how it works. It happens when an asset has remained in a certain range for a while. After the breakout happens, the trader becomes a trend-follower since the goal is to hold it to the end.
A good example of this is shown in the chart below. As you can see, Bitcoin remained in a tight range between 28,583 and 25,360. It then makes a bullish breakout is confirmed when the price moves above the resistance point at 28,583.
How to identify a trend
The easiest approach to identify a trend is to just look at a chart visually. When you do this, you will be able to tell whether an asset is in an uptrend, downtrend or whether it is in a tight range or is highly volatile.
It is worth noting that a simple visual inspection is not enough. Instead, it is recommended that you do a multi-timeframe analysis to confirm whether an asset is indeed in a trend.
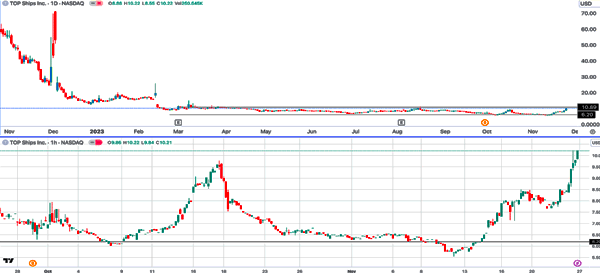
This analysis involves looking at a chart in several timeframes. In most cases, traders look at three time frames. The benefit of doing this is that a chart might look uninteresting in the daily chart. But when you shift it into the hourly chart, you see that it has a modest trend.
A good example of this is in the Top Ships chart shown below. The daily chart shows that it is in a consolidation phase while the hourly one reveals that it is in an uptrend.
How to analyze a trend
Identifying a trend is usually the first stage when it comes to trend-following. The next stage is where you analyze it with the goal of entering a position and when you will exit it.
There are a few things that you need to do when analyzing a trend. First, as mentioned above, always do a multi-timeframe analysis. This is important because it will help you see whether this trend is broad-based.
Second, add several trend indicators in the chart. Each of these indicators will give you more information about the chart.
Oscillators like the Relative Strength Index (RSI), Stochastic, and Money Flow Index (MFI) will help you know whether an asset is overbought or oversold.
Trend indicators like moving averages, Bollinger Bands, and Donchian Channels will help you know whether the trend is going on well. Further, indicators like the Average Directional Index (ADX) and Supertrend will help you know the strength of a trend.
Finally, look at emerging chart patterns in a chart. As We will explain below, there are reversal and continuation chart patterns. Having a good understanding of these patterns will help you know whether the bullish trend will continue or whether a reversal is coming.
The most popular chart patterns are flags, pennants, cup and handle, and head and shoulders.
How to do trend trading
There are a few approaches to trending. When done right, these approaches can help you identify trends early and ride them to their end. Here are some of these approaches:
Using technical indicators
The first approach in trend-following involves using technical indicators. These are tools derived from mathematical calculations that help people identify trends.
The most popular trend indicators are:
- Moving averages
- VWAP
- Donchian Channels
- Bollinger Bands
- Average Directional Index (ADX).
Using chart and candlestick patterns
The other approach involves using chart and candlestick patterns. These are unique patterns that can help you determine when a new pattern is about to form or when an existing one is about to end.
Candlestick patterns like doji, morning star, evening star, engulfing, and hammer are all reversal ones. When they form, it is usually a sign that an existing trend is about to end, which will lead to a new one.
Chart patterns take longer to form. Some of the most popular ones are the head and shoulders, flags, pennants, triangles, and wedges. H&S, wedges, and double-tops are reversal patterns while flags, cup and handle, and pennants are signs of continuations.
Trendlines
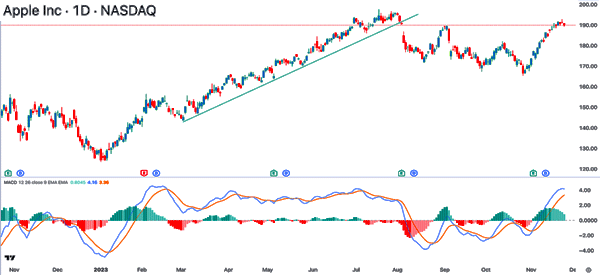
Another approach in trend trading is known as trendlines. This is a strategy where you draw a line that connects several important support or resistance levels. In this case, the price does well when the price is above the trendline.
A break below that level is a sign that the existing trendline is about to end. A good example of this is shown in the chart below. In it, we see that Apple shares were in an uptrend, which was supported by the ascending trendline.
Pullbacks and breakouts
Further, you can do trend trading using pullbacks and breakouts. A pullback is a situation where an asset in an uptrend retreats and then resumes the bullish trend.
A good example of this is in the chart above. In it, we see that the stock had regular pullbacks as it continued its bullish momentum.
A breakout, on the other hand, happens after an asset remains in a tight range or in a channel for a while.
In most cases, the price will ultimately have a bullish or breakout and start a new trend. Some breakouts are usually preceded by chart patterns like triangles and double-tops.
Trend trading strategies
Trend trading professionals use several strategies to identify emerging trends and ride them to the end. The core of these approaches is to buy an asset if you believe the price will continue rising.
Alternatively, you can short an asset that you believe will retreat in the foreseeable future. For example, if a stock is trading at $20 and you expect it to move to $15, you can place a short trade and take advantage of the drop.
There are several trend trading strategies, which we have covered in the previous section.
First, you can use the approach of technical indicators, where you use tools like moving averages and Bollinger Bands. In this, the goal is to buy an asset as long as it is above the indicator and exit when the trend changes.
Second, you can use chart patterns to identify new trends and reversals. Some of the top chart patterns are head and shoulders and flags. In this approach, you can also use candlestick patterns to identify new trends.
Third, you can focus on breakouts. This is where you wait for an asset to move out of a consolidation phase or a chart pattern to make your move. It is also possible to use technical indicators to trade these breakouts.
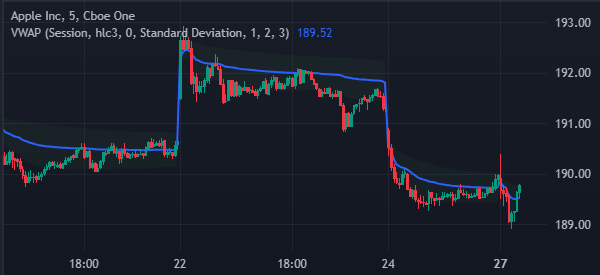
In the chart below, we see that Apple shares moved above the VWAP indicator, which can be a good purchase price.
Exit strategies for trend
As part of these strategies, it is important to know when to exit a bullish or bearish trade. Traders use several approaches to do this. Some of them exit a trade when oscillators like the RSI and Stochastic move to the extreme overbought level.
Others exit their trades when the price moves below and above trendlines. A break below an ascending trendline is usually a sign that the bullish trend is fading. Similarly, if a price moves below a trend indicator, it is a sign that the trend is ending.
The other exit strategy is simply to look at emerging chart patterns that are signs of a reversal. For example, if a trending asset forms a chart pattern like a double-top or a triple-top, it is a sign that an existing trend is about to end.
Risk management in trend trading
Risk management is an important part in all forms of trading. The goal is to maximize your returns while reducing risks in the market. Trend traders use several risk management strategies, including:
Trailing stop loss
A trailing stop loss is a tool that stops a trade automatically when it reaches a certain level. This type of a stop is better than a standard stop-loss in that it is more flexible and that it captures profits in case of a reversal.
In a standard stop-loss, you can place a buy trade at $20 and add a stop-loss at $18. In this case, if the stock rises to $22 and then crashes to $17, it means that you will make a loss. A trailing stop prevents this situation by ensuring that the initial profits are captured.
Pairs trading
The other risk management strategy is known as pairs trading. This is where you trade two financial assets that are closely correlated or uncorrelated to prevent risk.
If you buy a stock like Visa, you can then short Mastercard. In this case, the profit will be the spread that exists between the two.
Take profit
A stop-loss is a good tool in that it prevents substantial losses from happening. A take-profit, on the other hand, is a tool that stops a trade when it gets to a certain profit level.
It is an important tool that you should use because it will help you capture profits in line with the strategy.
Manual exits
The other risk management strategy is simply to exit your trades manually when they get to certain levels. You can exit a trade when the chart starts forming reversal patterns like head and shoulders, double-top and bottom, and wedge.
Also, you can exit a trade when it forms candlestick patterns like doji, hammer, morning and evening star.
The other top risk management approaches to use are position sizing and leverage control. In position sizing, you should always place small trades to prevent making huge losses. Also, you should avoid using substantial leverage sizes.
FAQs
Is trend trading profitable?
Is trend trading suitable for beginners?
What are the drawbacks of trend-trading?
Second, it is possible to enter a trending trade, which then reverses shortly after that.
Third, a trend can change if there are major issues in the market. For example, a company can publish a weak financial report that changes the overall market sentiment.
Trend following works in stocks?
Summary
Trend following is a strategy that is also known as momentum trading. Momentum traders hope to identify a trend and then follow it to the end. In this article, we have looked at some of the most commonly-used trend following strategies and how to use them well.
To succeed, you will need to practice it for a while in a demo account. Which of these strategies do you appreciate the most?
External Useful Resources
- Why does trend following trading work? – Turtle Trader
