Trendlines are an important part of both investing and day trading. Indeed, it is almost impossible to trade well without having knowledge of these concepts.
Trendlines are important because successful traders are those who find a trend early and then ride it to the end. And guess what? One of the most effective ways to do that is just using this tool.
In this article, we will look at what trendlines are, how to draw them, and how to use them successfully during your analysis.
What are trendlines?
To understand what a trendline is, it is important for you to know more about trends. A trend refers to a situation where a financial asset is moving in an upward or downward direction in a systemic way.
The opposite of a trend is when the asset is either moving in a horizontal direction or when it is moving in a highly volatile manner.
The chart below shows that Cresco Labs shares are moving in a downward trend.
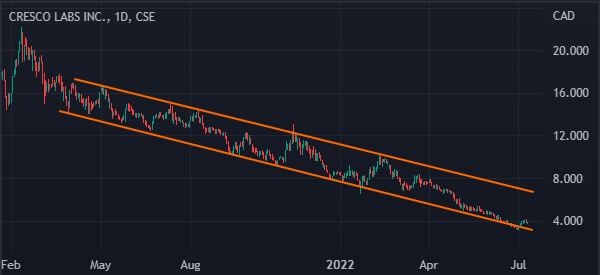
In most periods, a trending asset usually moves in a systematic manner where it has specific points of contact. These points are known as support and resistance.
Therefore, a trendline is when you connect the lower (or upper) levels of the asset. For example, in the chart above, the two lines can be described as trendlines since they connect specific locations.
Trendlines vs channels
Another concept that is important when you look at trendlines is known as channels. A channel happens when an asset has formed a series of support and resistance points.
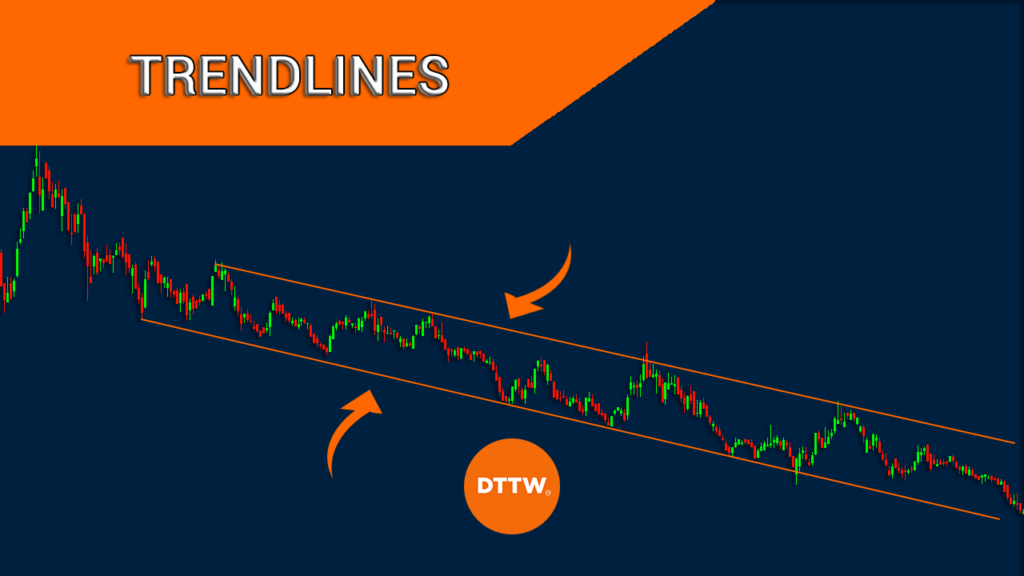
An example of a good channel is the one shown in the first image. Therefore, a channel is formed when there a chart has two trendlines.
There are several strategies for trading a descending or ascending channel. For example, you can place a buy trade when it tests the lower trendline and then place a short trade when it tests the upper channel. Another strategy is that of using pending orders above and below the ascending and descending channels.
What to know about trendlines
There are several things that you need to know about trendlines. First, these lines can happen in charts of all durations, including hourly, monthly, and weekly.
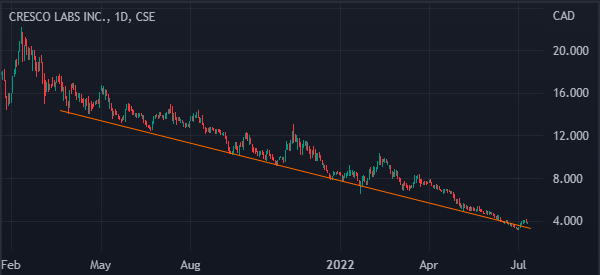
Second, a trendline is made up of support and resistance points. Support is a floor where an asset struggles to move below while resistance is a ceiling where the asset struggles to move above. In the chart below, support is the lower side while resistance is the upper side.
Third, a good trendline touches several points. Ideally, ensure that the line you draw tests at least three points.
Fourth, a trendline is made up of areas of false breakouts. A false breakout is where a price moves below or above a trendline and then quickly move above or below the line. A good example of a false breakout is shown in the chart below.
Finally, trendlines are very useful for day traders and investors because they help them to identify entry and exit points.
How to draw trendlines
Drawing a trendline is a relatively easy process to follow. Besides, most charting platforms like TradingView and MetaTrader provide tools to do the process easily. The chart below shows the tools you need to use when drawing trendlines in TradingView.
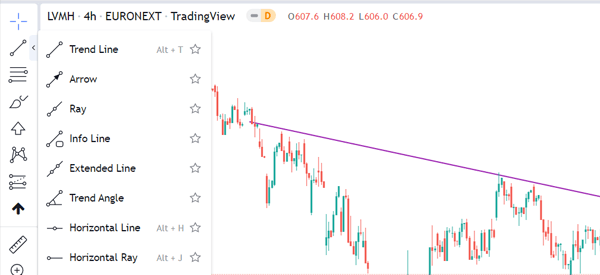
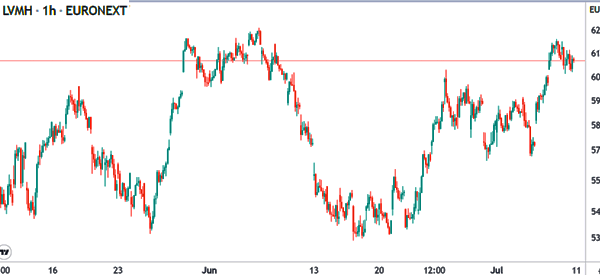
The first step to draw a trendline is to look at a chart. A brief look at a chart can tell you whether a trendline can be drawn or not. For example, a look at the LVMH chart below shows that it is incredibly difficult to draw a trendline on it.
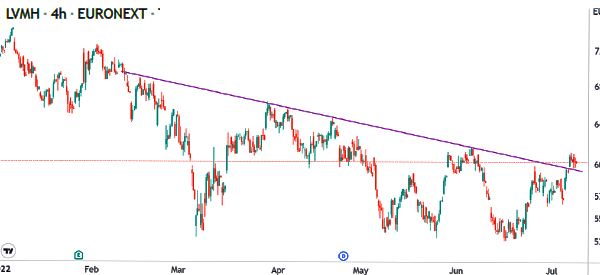
If you can’t find a trendline, a good way is to switch the chart’s period. In most cases, if you can’t find a trendline on a hourly chart, you will likely see it on the four-hour or daily chart.
For example, in the chart below, you can see that LVMH had a descending trendline on the four-hour chart.
Trendline trading strategies
There are several strategies that you can use when trading using trendlines. Let’s go over the ones that will benefit you the most.
Trend following
Trend following is a trading strategy where a trader buys an asset that is rising or shorts one that is falling. The goal is to initiate that trade and hold it until signs of a reversal emerge.
A good example of this is in the chart below. As you can see, Microsoft formed an ascending channel that is shown in orange.
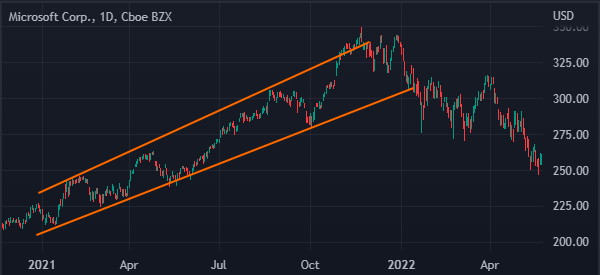
Now, in trend-following strategy, a trader would have placed a buy trade and held it until the price moved below the lower side of the trendline.
Trend-following is better done by combining these trendlines and other trend indicators like moving averages and Bollinger Bands.
Trade breakouts
Another strategy to use when trading using trendlines is using breakouts. A breakout happens when a price moves above or below a trendline. A good example of this is in the LVMH share price shown above.
As you can see, the price is having difficulties moving above the descending trendline shown in purple. Therefore, a trader could place a buy-stop trade above the trendline. In this case, if there is a reversal, a new bullish trend will be initiated.
Trendline reversal
Another common strategy when trading using trendlines is looking for trend reversals. A reversal happens when an asset moves below or above an ascending trendline.
The idea is that a trendline does not last forever and that it is usually followed by a reversal. Therefore, if an asset has a bullish trendline, you could place a bearish trade when it moves below that line.
Related » The Best Reversal Patterns
Moving average for trendlines
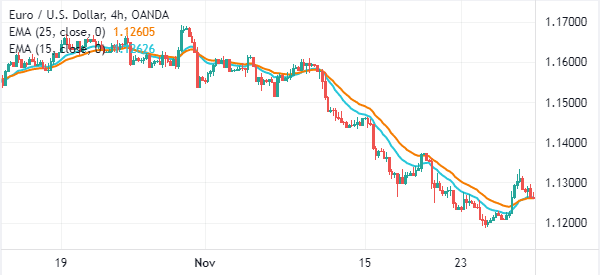
Moving average is one of the best tool to use when trading using trendlines. It is a trend indicator that is used to confirm a bullish trend or even find a reversal.
One of the best strategies for incorporating moving averages into trendlines is that of using two MAs. A bearish breakout will be confirmed when the two MAs make a crossover.
Summary
In this article, we have looked at the concept of trendlines and why they are important in the market. While the concept may seem complex, it is actually one of the simplest ones to use. The key to success is to keep practicing in a demo account before you use it in a live account.
External useful resources
- How do the trendlines work on stock charts? – Quora
