Traders use technical indicators as the best way to predict the future movements of an asset. There are hundreds of indicators that are available today. Some of these indicators are provided freely by most trading platforms. Others must be downloaded and installed into these platforms.
At Real Trading, our goal is to empower our existing and future traders to become excellent at what they do. As such, we have spent the past few weeks writing in-depth educational articles on technical indicators.
Regardless of whether you prefer to trade in a low-volatile or high-volatile market, you need to measure volatility. There are many tools to do this too. In this article, we will look at the Arms Index, which is not a popular (and in many cases not very effective) indicator.
What is the Arms Index (TRIN)?
The Arms index is also known as the TRIN or the Short-Term Trading Index. Where does the word TRIN come from? It’s simply a combination of Trading and Index. The index was first suggested by Richard Arms in 1967. Richard was a trader and financial researcher, who has published several books on trading.
The indicator is an oscillator and a leading indicator. It is used as an important measure of volatility. In a past article, we just explained what volatility is and how traders identify it.
Importantly, we looked at the CBOE volatility index (VIX), which is one of the most popular measures of volatility. We identified how it is measured and how it is used in the market.
Other indicators that are used to measure volatility are the Bollinger Bands, Envelopes, and the Relative Vigor Index.
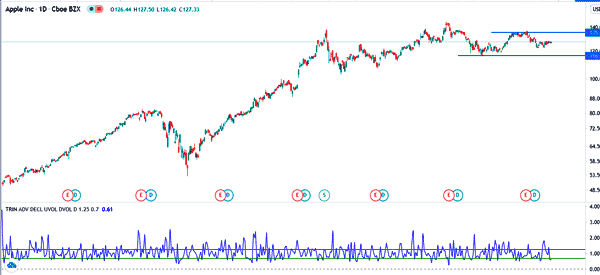
The chart below shows the TRIN indicator applied in the Apple stock.
Arms Index Formula: How TRIN is Calculated?
The Arms index is calculated by first calculating the advance-decline ratio and then the advance-decline volume ratio. In most cases, these numbers are derived from the data provided by major data providers.
The formula for calculating the index is:
| (advances / declines) / (advancing volume / declining volume) |
What are these numbers?
Advances is the number of stocks that moved higher in a day while declines are the stocks that declined in the day. Meanwhile, advancing volume is the volume of stocks that gained. Declining volume is the volume of stocks that fell in a day.
Therefore, as this formula suggests, the Arms Index is better used for stocks. At the same time, it is not necessary for you to manually calculate the indicator. Instead, you can just apply it on your charts and then interpret it.
How to Use the Arms Index
There are several methods of using the Arms Index when trading. As mentioned above, you need to ensure that you are trading stocks. This is because the index tells the volatility involved in the stock market. As such, the signals it generates in other markets may not be very accurate.
When you calculate the TRIN indicator, there are three possible results. First, if the result is 1, it is a sign that the AD ratio is equal to that of the AD volume ratio. This means that the market is neutral.
Second, the result can be less than 1. In this case, it means that the value of AD volume results in a higher ratio than the AD ratio. When this happens, it means that the stock will likely continue rising.
Finally, the result can be above 1. In this case, it means that the AD volume results in a smaller ratio than the AD ratio. This is usually a sign of a bear market.
Using Arms index to find overbought and oversold levels
One of the popular approaches for using the Arms index is to find overbought and oversold levels. An asset is said to be overbought when it becomes extremely overvalued or when its price has jumped so high at a fast pace.
Similarly, an asset becomes oversold when its price drops sharply and becomes cheap. While some traders use TRIN to find these levels, we recommend that you use other oscillators like the Relative Strength Index (RSI) and Stochastic Oscillator.
It is relatively easy to use the TRIN index to find these levels. First, you need to select the asset, which could be a stock, currency pair, a bond, or a commodity.
Second, select the right period of the asset. When using the indicator, a longer chart will always send false overbought and oversold signals, as shown below.
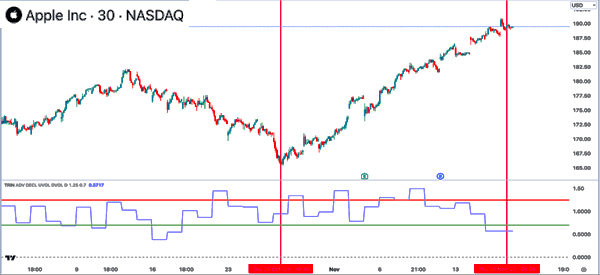
A short duration chart will identify solid overbought and oversold levels. However, as the chart below shows, most of these levels are not good buy and sell signals.
Also, the indicator does not move with the chart, as shown in the highlighted part, the TRIN indicator and the chart had no correlation.
Combining Arms Index with Other Indicators
The best way of using the Arms Index is to combine it with other indicators. The benefit of combining the indicator is to avoid getting a false signal.
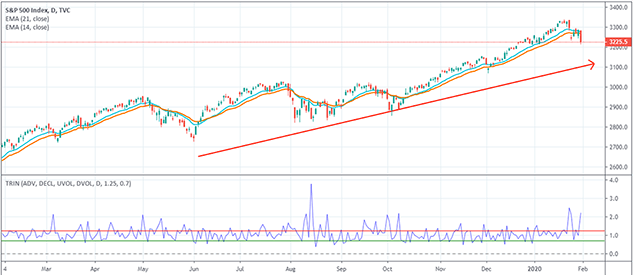
As you can see below, the S&P 500 was in an upward trend for 2019. As it did this, the Arms Index was below 1.0. This is a sign that the strength was strong. This again is confirmed by the double exponential moving averages that have been used.
Cons of using the TRIN Indicator
There are several cons of using the TRIN indicator. First, identifying the buying and selling signals is a relatively difficult process, as shown in the example above.
Second, unlike most technical indicators, it is not provided in popular trading platforms like MetaTrader. To use it in these platforms, you will need to download it from the marketplace, which is a relatively long process.
Third, the TRIN indicator tends to provide the wrong signals. For example, it is common for the indicator to be at an oversold level in a period when a financial asset is rising.
Finally, the TRIN indicator is only applicable in the stock market. Unlike other indicators, it cannot be used in other assets like cryptocurrencies and commodities.
Conclusion
Volatility is an important thing to consider when participating in the financial market. Most traders prefer participating in a low-volatile market while others make more money when there is more volatility.
Knowing how to measure this volatility is an important thing for you to do.
In this article, we have looked at an indicator that is not very popular among participants. This is what makes it unique. Using it can help you become a better trader and anticipate future happenings. But beware of false signals.
External Useful Resources
- NYSE’s Arms Index is implying panic-like, sell-on-rally activity – Marketwatch
- TRIN Index in Stockchart.com
