There are two main types of chart patterns in the financial market: continuation and reversal. Continuation patterns signal that an asset’s price will keep rising while reversals are signs that the asset will start a new trend.
In this article, we will focus on one of the most popular reversal patterns that is known as triple bottom.
What is the triple bottom pattern?
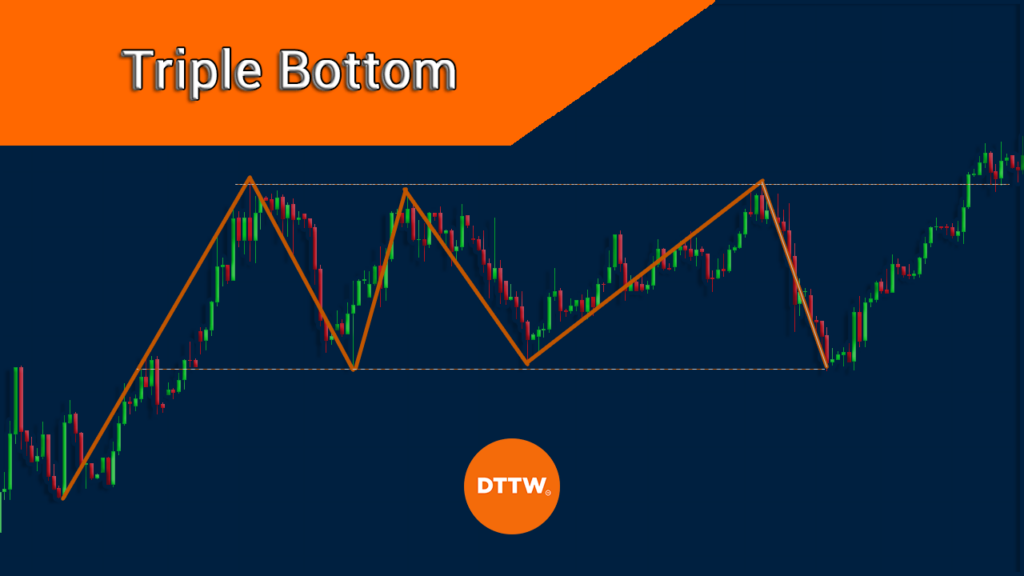
A triple bottom pattern is one of the most popular bullish reversal patterns in the financial market. When it happens, it usually increases the possibility that an asset’s price will start a new bullish trend. The pattern forms when an asset’s price forms an important support and then starts bouncing back.
As it is rising, the asset finds an important resistance and then declines again. In this case, it declines and settles at the important support level. It then bounces back and ultimately comes back to the support level.
In most cases, the triple bottom pattern usually leads to a bullish breakout. The triple-bottom pattern is also known as a W pattern because of how it looks like.
It is worth noting that during the formation of a triple bottom pattern, the first one that forms is a double-bottom pattern. In a double-bottom, the price usually finds a support, moves upwards, settles at the support again, and then makes a bullish breakout.
What the triple-bottom tells traders
The triple-bottom pattern tells traders a number of things. First, it tells them that the financial asset has found a strong support. In other words, bears are usually unable to move below the lower side of the support level.
As such, if the price manages to move below the level, it can be a sign that the bullish view has been invalidated.
Second, the triple-bottom pattern tells that bulls are prevailing when the price moves above the upper side of the pattern. Finally, it usually tells them that a new bullish reversal pattern may be about to form.
How to identify a triple bottom pattern
Identifying a triple bottom pattern is relatively easy. First, you need to identify a chart whose price is moving in a downward trend. It cannot form during an uptrend period.
Second, the three levels of support need to be near equal. As you will find out, these levels will not always be 100% horizontal. But they need to be a bit equivalent. Also, it is worth noting that the lower side of the triple-bottom pattern can be slanted.
Third, volume plays an important role in the formation of this pattern. Volume will typically increase when the price is approaching its lowest point.
Another thing to remember is that the resistance break will often validate the triple bottom pattern.
Finally, the target of the price is usually estimated by looking at the support level and the upper side. In some cases, the price will rise in an equal distance.
Another thing to note is that the triple bottom pattern should be seen as a bullish sign when the price moves above the resistance.
How to trade the triple-bottom pattern
An important fact to note is that a triple-bottom pattern can only be identified when the price moves to the support for the second term. Before that, it is a bit difficult to say whether it is a real triple bottom pattern.
Pay attention to false breakouts
Another thing is that false breakouts are usually popular when trading double-top and a triple top patterns. A false breakout usually happens when the price forms a bullish breakout and then returns back to the channel.
Check the volume
Further, it is always important to look the trends in volume of the asset that you are trading. Volume is an important part of price action trading.
One way to trade the triple-bottom is to identify when it form and then just wait for the price to move above the upper resistance level.
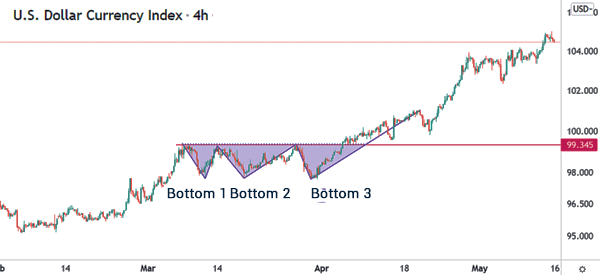
A good example of a triple-bottom is in the dollar index chart below. Unlike what we said above, this pattern has formed in a period when the index was previously rising. So, it is possible to find the pattern during an uptrend.
In this case, a buyer would have placed a buy trade slightly above the upper side of the resistance at $99.34.
Place a buy/sell stop
Another way is to set a buy-stop trade slightly above the resistance level. In this case, the buy-stop trade will be executed if the thesis is validated. Similarly, you can place a sell-stop trade below the lower side of the triple-bottom. This trade will be executed if the bullish view of the pattern is invalidated.
Some traders also trade the channel that emerges before the bullish trade emerges. In this case, one will short when it hits the resistance and buy when it moves to the support point.
Triple bottom vs triple top
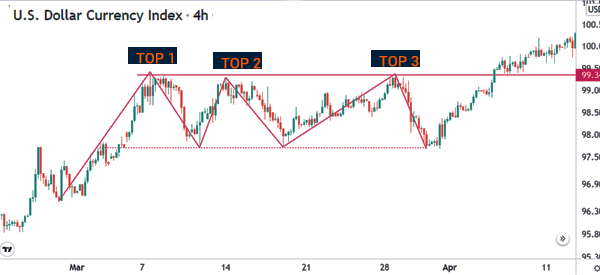
The opposite of a triple bottom pattern is a triple top. The pattern happens when an asset is in a bullish trend. And when it forms, chances are usually high that the price will have a bearish breakout.
However, as shown below, a triple-top pattern can result to a bullish breakout especially when the price manages to move above the upper side of the pattern.
Summary
The triple-bottom pattern is a popular trading pattern (for reversals) in the financial market. In this article, we have looked at some of the most important parts of the pattern and the insights it provides to traders.
We also explained how to use it to find the best entry and exit points from a trade and highlighted the risk of false breakouts that the pattern might present.
External useful resources
- How the Triple Bottom Reversal Pattern Works – Option Strategies Insider
