The TSI is one of the most useful indicator for Technical Analysis, but many traders do not see him favorably. Well.. they are wrong! In the past few weeks, we have taken a deeper dive into some of the best technical indicators to use.
We have covered popular indicators like Stochastic, the Relative Strength Index (RSI), the Relative Vigor Index (RVI), and the Accumulation/Distribution among others.
The goal of this series is to introduce traders to these indicators and help them to use them in the financial market.
In this article, we will look at the True Strength Index (TSI). This is an indicator that is not well-known by most traders. Still, as you will see below, it is one of the most effective ones!
What is the True Strength Index?
The True Strength Index (TSI) is a momentum oscillator that was proposed by William Blau. He wrote about it in the then-popular Stocks & Commodities Magazine. As with other oscillators, the TSI can be used to identify trading signals.
Most traders use it to identify potential oversold and overbought levels. Others use it to find centreline crossovers while others use it to identify bullish and bearish divergencies.
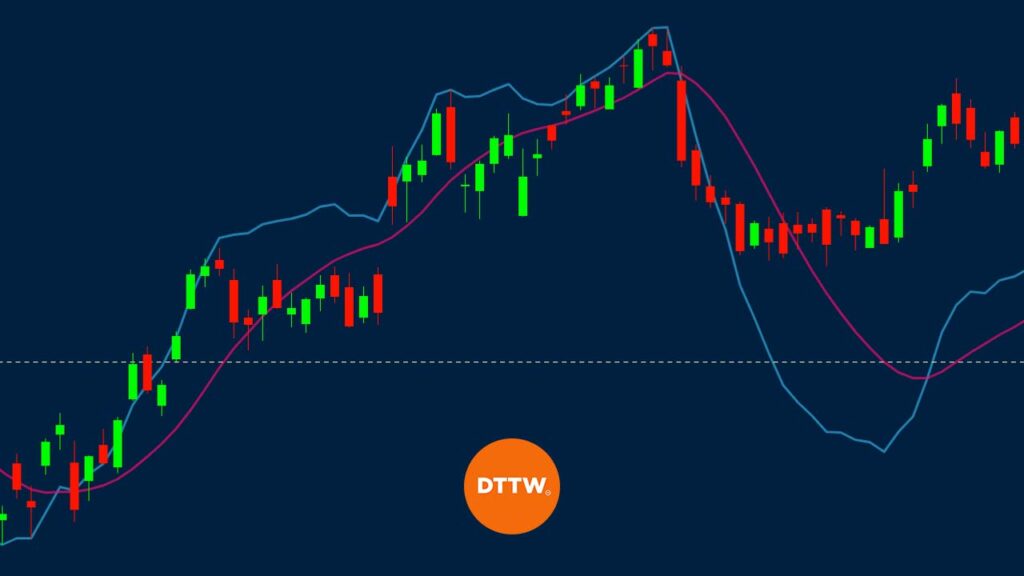
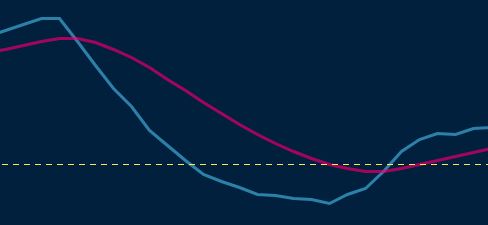
When it is applied on a chart, the TSI has three lines. The horizontal line is known as the zero line while the other two are known as the plots. These two are the ones that provide signals to traders.
TSI Formula
As we have written before, it is not mandatory that you know how an indicator is calculated. The most important thing you need to know is how to apply the indicator and interpret it.
There are three main steps of calculating the TSI.
- First, you need to calculate the change in price from one period to another.
- Second, you should now calculate the 25-period exponential moving average of this price. The 25-period is usually the standard. Still, you can tweak it to suit your trading strategy.
- Finally, you should calculate the 13-period EMA for the 25-period EMA. This will help you double-smooth the process.
Let’s simplify this process below.
- Price Change (PC) = Current price – Prior Price
- First smoothing = 25-period EMA of the price change.
- Second smoothing = 13-period EMA of the 25 PC.
- TSI = 100 x (Double smoothed PC / Double Smoothed Absolute PC).
TSI vs ATR
The True Range Indicator (TSI) is often confused with the Average True Range (ATR) indicator. The ATR indicator is an important measurement of volatility in the market. It basically looks at the gaps in price movement in a certain period. The most common period in the calculation of the indicator is 14-days.
It is calculated using the formula: ATR = (Previous ATR X (n – 1) + TR) / n
In this case, n is the number of periods or bars while TR is the True Range. The TR is calculated by subtracting today’s high from the today’s low.
The two indicators are usually used differently. While the True Range is used to find overbought and oversold levels, the ATR is mostly used to measure the volatility in a financial asset.
»Everything about Volatility in trading«
Crossovers, Oversold and Overbought. How to Use the True Strength Index
As with the other momentum oscillators, the TSI should only be used in intraday when the price of an asset is trending. Using it when the price is moving sideways or consolidating is not ideal.
Doing this will often give you the wrong signals!
The first method of using the True Strength Index is to look at the crossovers. In most cases, when the two plot lines makes a crossover, it is usually a sign that the price will start a new trend.
A good example of this is shown on the USD/CAD pair below. The blue lines show when a bullish crossover was made while the red arrows show where the bearish crossover happened.
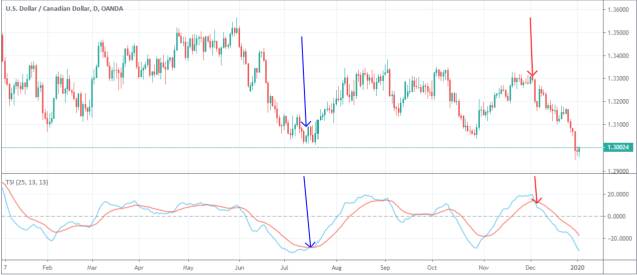
Another way is to identify the overbought and oversold levels. An overbought level sends a signal that you should short an asset while an oversold level signals that you should buy the asset. This is also shown on the chart above.
True Strength Indicator best settings
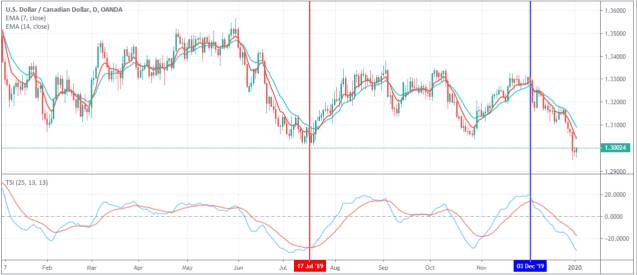
One of the best ways of using the True Strength Index in day trading is, as usual, to combine it with other indicators.
You can combine it with indicators like moving averages, Ichimoku Kinko Hyo, and Parabolic SAR. Doing this helps you reduce the risk of getting a false signal.
A good example of this is shown below.
This chart combines the TSI with the double exponential moving averages. As you can the intersections of the TSI happen at almost the same time as the 7-day and 14-day moving averages.
Why you should use the TSI? Pros and Cons
There are several benefits of using the True Range Indicator. Some of these are:
- Relatively easy-to-use indicator especially in a ranging market.
- Useful indicator when finding overbought and oversold levels.
- This is also an important indicator that shows you when a reversal is about to happen.
- Finally, it is useful when you want to complement other indicators like the Relative Strength Index (RSI) and the MACD.
Like all indicators, there are limitations of using the True Range Indicator. Some of these cons are:
- The indicator is often confused with the Average True Range (ATR).
- The True Range Indicator is not provided by default by MetaTrader and TradingView.
Key Take-Away
The RSI is a popular technical indicator in Wall Street. However, it is not very popular among many retail traders because it does not come preinstalled in many charting platforms.
Still, as you have seen above, it is one of the simplest indicators to use!
External Useful Resources:
- Example of TSI Chart on Tradingview
- More technical info about TSI on StockCharts.com
