What are options in simple terms?
The options trading industry is a vast one, especially in the United States. A good options trading definition is one that allows you to buy or sell a financial security at a predetermined period in time at a certain price. It gives you a right but not an obligation to buy or sell the asset.
Data in the options market is provided freely by many online platforms like Barcharts and Webull. As a result, it is possible to see how large and small investors are positioning themselves for the future.
As such, unusual options activity is the process where you study activities in the options market and see some unusual activity.
For example, if the stock is trading at $10, you could identify a large call option in the next three months. This means that there is a large trader or investor who expects the stock to rise during this period. This also works very well with the various commodities.
Put and call definitions
To understand the unusual options activity, it is important that you know what a call and put option are. That’s because the two are the main order types in the options market.
A call option gives you a right, but not an obligation, to buy a stock at a predetermined level in a certain period. For example, if the stock is trading at $10, you could have a call option that buys it when it rises to $14.
A put option, on the other hand, gives you a right but not an obligation to short a stock at a certain point. It is the exact opposite of a call option. For example, if the stock is trading at $10, you could place a put option at $8.
To trade options in the United States, you just need to find an online broker that offers the service. Among the best-known brokers that offer these options are Robinhood, Interactive Brokers, TD Ameritrade, and Schwab, among others.
What is an unusual options activity?
The activity in the options market is important because many insiders, investors, and investment bankers use options. Therefore, looking at this data carefully can give you more details about whether to buy or short a stock.
For example, many insiders usually know whether the company is doing well or not. They have information that many other investors don’t have.
For example, recently, when the Wirecard crisis came out, many senior executives knew more about the fraud the company was carrying out. Therefore, many started selling their stocks.
Another perfect example is what happened on September 9, 2001, when terrorists hit New York. Shortly after that, shares of all airline stocks declined sharply. A closer look at the data showed that there were some investors who had previously shorted these stocks, meaning they know what will happen.
Therefore, looking at this unusual activity can help you find trading opportunities.
The unusual options activity dashboard
As a trader, the best place to start when you want to incorporate unusual options activity is to find this data. One of the best websites to do that is barchart.com. The chart below shows how the unusual options activity dashboard looks like.
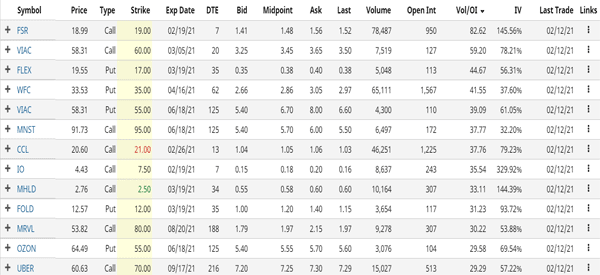
In this table, we can see some of the top companies with unusual options activity. There are several key parts in the table:
- Symbol – This shows the company. For example, WFC is the symbol for Wells Fargo while UBER is the ticker for Uber.
- Price – This is the current share price of the stock.
- Type – This is the type of the option. It can be a call or put option.
- Strike – This is the price where the holder of the option can buy or sell the stock.
- Expiration date – This is when the call or put option will expire while DTE is the number of days for the order to expire.
- Bid – This is the bid price of a stock while the midpoint is the middle point of the bid and ask price.
- Volume and open interest – The volume is the number of shares in the options contract while open interest is the number of options that have been traded but not exercised
- Vol/OI – This is the ratio of the volume and the open interest.
Types of unusual options activity
There are two main types of unusual options activity.
Block trades
Block trades are privately negotiated trades that mostly happen among large institutions like hedge funds. These trades are usually negotiated privately through an intermediary like a broker. They mostly happen through derivatives like futures and options.
The goal is to open several small trades without disrupting the market. For example, if you place a $1 billion trade instantly, the chances that a stock will move sharply because of that bullish volume.
Sweep trade
The other type of an unusual options activity is known as a sweep trade, which is similar to a block trade. This is a type of order where a broker splits a certain order into smaller parts to take advantage of the order sizes and the best prices.
How to identify Unusual Option Activity (UOA)
A common question is on how to identify Unusual Option Activity. The first step is to identify options data of stocks. Fortunately, there are many free platforms that provide free option chains. WeBull is one of the best of these platforms.
As shown below, we have the options chain for 8th December 2023 and January 5th 2024 for Tesla, which was trading at $241.27 at that time.
In this chart, we see that there is a call option for $250 that has a high open interest of 2,485. This is a sign that there is a high possibility that the stock.
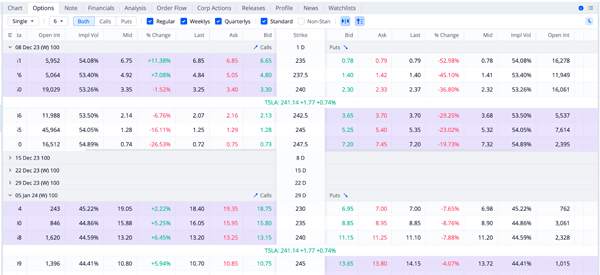
As you look at these numbers, there are several important factors to look at. First, always look at the open interest, which shows the number of outstanding contracts in the market. A higher open interest is usually a better thing.
Second, look at the volume, which shows the number of trades in a given time. Further, look at the expiration date, strike price, and the price paid. Expiration date is when the options will expire while the strike price is when the person can buy (calls) or sell (puts)
How to use the unusual options activity
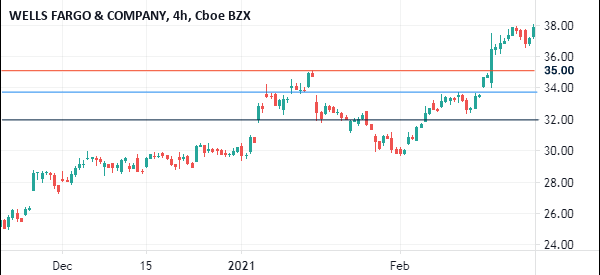
The first step of trading using the unusual options activity is to find it, as we have seen above. Next, you need to dig deeper into this data. For example, in the chart above, we see that there is some unusual activity in Wells Fargo.
With the stock trading at $33, traders have bought put options for the stock at $35 that will expire on 04/16/21. The volume of this is 65,300, meaning that the option traders are relatively convinced. Also, the open interest is at 1,567.
As shown below, this 35 is both an important psychological level and an important resistance level.
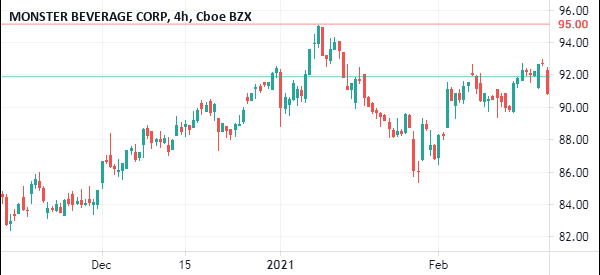
Another good example of this is Monster Beverages (MNST). As shown, the stock is trading at $91.73 and has a call option with a strike price at $95 that will expire on June 18. As you can see below, this is not an arbitrary number.
Instead, it is an important resistance level where the stock has struggled to move above before.
Correlation between stock prices and UOA
In theory, there should be a close correlation between a stock price and the unusual options activity. However, in most cases, this correction does not always happen.
This happens because of the size of the options trade, the underlying asset, and the timing of the options activity.
Risks of Unusual Options Activity
Many experienced traders have mastered the concept of unusual options activity well. As a result, their approach usually provides solid returns. However, there are several risks associated with the approach.
First, the approach can provide false signals because option chain data does not provide a lot of information. For example, while a put option can be a sign that a person is short an asset at a future date, it can also be a hedging approach.
Second, UOA does not provide a lot of information about trades in the options market. As such, it is difficult to interpret the options market, which will see you make the wrong decision.
Third, there is limited correlation between the stock price and the unusual options activity. Finally, there is the risk of market manipulation and insider trading in the financial market.
Advantages of unusual options activity
There are several benefits of using unusual options activity, including:
- Early indication of the next price action of a stock.
- It can be ideal in identifying large block trades, especially from hedge funds.
- It can help you to analyze options expiry dates.
- Also, UOW can help you to compare it among different companies.
Final thoughts
The options industry is a large one. In fact, while most brokers are offering free stock trades, they have not lowered the fees they charge for their options contracts. Using the data in the options market can give you more insights about stocks and how investors predict they will move in the future.
External Useful Resources
- Understanding Snap’s Unusual Options Activity – Benzinga
