Scalping is a popular day trading strategy in which a trader seeks to benefit from extremely short-term market moves.
Scalpers typically open tens or even hundreds of trades in a given day and take small profits or losses on each of these trades. In this article, we will look at how scalping works and how to use it well with chart patterns.
How scalping works
Scalping is one of the many day trading strategies that people use in the financial market. It refers to a process where people buy and sell financial assets within a few minutes.
This process can be both manual and automated. On automation, many scalpers are now using trading robots, also known as expert advisors, to find opportunities and execute orders.
The goal of a scalper is not to make a lot of money per trade. Instead, they focus on making a small amount of money in profit per trade multiple times per day. For example, if your goal is to make a $50 profit per trade 10 times per day, that is equal to about $500.
Scalping differs from other trading strategies like swing trading and position trading. One way this happens is that scalpers rarely pay a close a close attention to market fundamentals like news and economic data. Instead, scalpers focus on chart patterns to identify market opportunities.
Another difference is that scalpers use extremely short-term charts. In a recent article, we explained how traders use 1-minute charts to day trade.
Related » How to improve your scalping
What is price action?
Price action is a term that refers to the overall chart pattern of a financial asset. It is an analysis process where a trader looks at a chart’s appearance and then makes decisions accordingly.
A price action analysis is a type of technical analysis that does not need the use of technical indicators like moving averages and Relative Strength Index (RSI).
Price action is useful for all types of traders. Long-term traders use the strategy to identify opportunities to buy or short. In fact, some chart patterns like cup and handle are only useful for traders with a long-term horizon.
How to use chart patterns in scalping
Using chart patterns in scalping is a relatively simple process. It involves identifying chart patterns and then placing trades accordingly. For starters, there are two main types of charts in day trading: reversal and continuation.
Reversal chart patterns are those that indicate that an asset will change direction soon. On the other hand, continuation patterns signal that a chart will continue its bullish or bearish trend in due time.
These patterns can also be divided into two. First, they can be divided into candlestick patterns like doji, harami, shooting star, and morning star among others. Second, they can be divided into chart patterns that take time to form and involve more candles.
Related » How to Trade with 1 Single Candlestick?
Therefore, using these patterns in trading is relatively easy. All you need to do is to identify the chart pattern on a short-term chart, interpret it, and then place your trades accordingly.
Examples of chart patterns in scalping
Flags
Flag patterns are simple continuation patterns that happen when an asset is either rising or falling. They happen between these trends and are signs of a continuation.
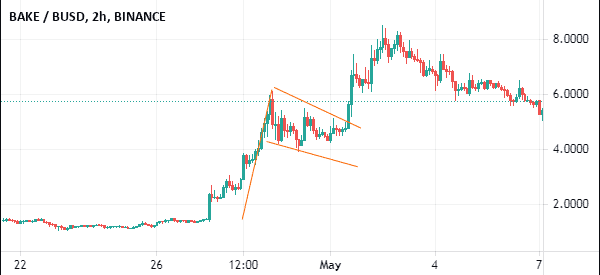
Bullish and bearish flag patterns are made up of a “pole” and a “flag”. When they happen, traders assume that the chart pattern will continue moving in the existing direction.
Flags simply happen when these trends take a breather. A good example of a bullish flag pattern at work is shown below.
Doji
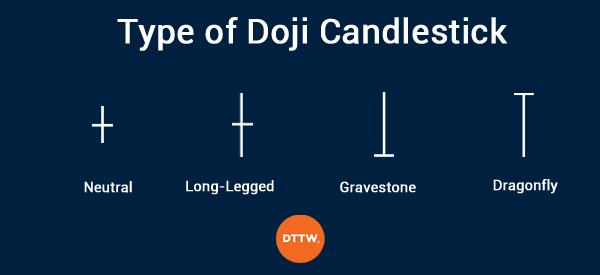
A doji is a candlestick pattern that is formed when an asset’s price closes where it opened. It is characterized by an extremely small body and short upper and lower shadows.
There are other types of doji patterns, including gravestone, long-legged doji, and dragonfly doji pattern, as shown below.
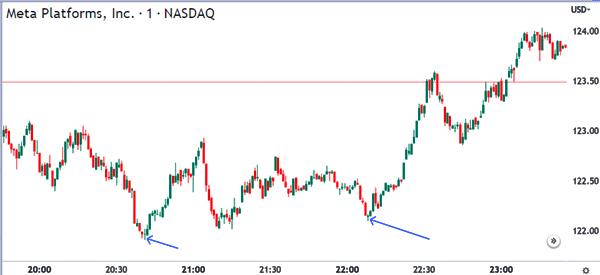
In the chart below, we see that Meta Platform’s chart reversals happened after the stock formed doji patterns. After identifying a doji, a scalper can execute a bullish or bearish trade based on the previous chart pattern.
Engulfing pattern
An engulfing is a two-candle chart pattern that happens when a downward or upward trend is fading. The pattern is characterized by a candlestick that is followed by a bigger one that covers it.
The second candlestick covers the first one fully. After this happens, the scalper can open a trade in the opposite direction.
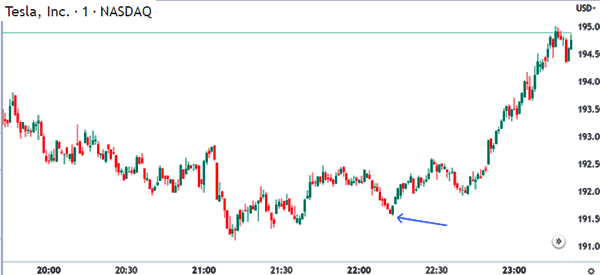
A good example of this pattern is shown in the chart below. As you can see, Tesla shares formed s a small engulfing pattern that was followed by a bullish breakout.
Double-top pattern
The double-top pattern is a popular reversal pattern that forms in all types of charts. When it forms, it is usually a sign that a financial asset will soon reverse and start moving in the opposite direction. It is characterized by a flat top and a neckline.
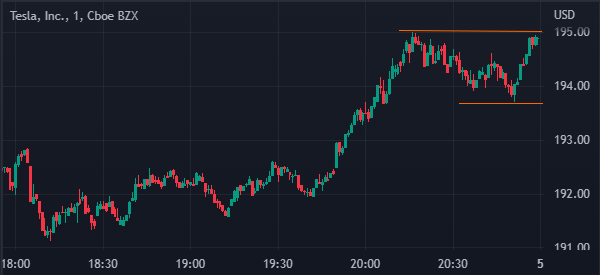
In this case, a trader can open a trade and set a take-profit at the neckline. In the chart below, we see that Tesla is forming a double-top pattern at $195. Its neckline is at $190. Therefore, a scalper can open a bearish trade and place a take-profit at $193.
Morning star pattern
The morning star pattern has a close resemblance to a doji pattern. It is a small pattern that happens at the bottom of a trend.
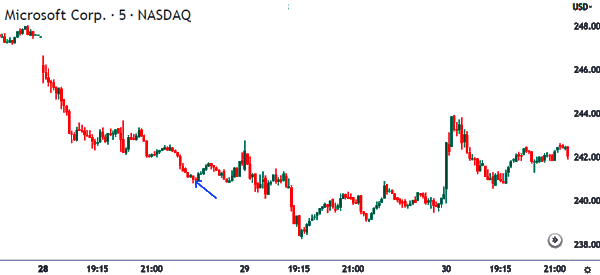
When it happens, it sends a sign that the asset’s price will have a reversal in the near term. The chart below shows a small morning star pattern that is followed by a small reversal.
Summary
A scalper can engage in several strategies to make his trades profitable. Among these, arguably chart patterns are among the most useful.
We have seen the most common – often the best – but there are other chart patterns that are used in price action analysis. Some of those we have not covered here are abandoned baby, head and shoulders, shooting and evening star, rectangle, and triangle pattern. What is your favorite approach?
External useful resources
- Is Price Action a good strategy for scalping purposes? – Quora
