In the financial market, no one can predict accurately how an asset can move. In many instances, people who try to predict the future prices without any analysis fail.
This is because the market is made up of complex parts that move as a result of different triggers.
To make better predictions, traders, analysts, and investors use various analysis methods. While these analysis methods are not accurate, they help the investors in making the best possible decisions.
Moving averages are important and popular technical indicators in day trading and investments. They are widely used in trend-following, reversals, identifying support and resistance levels, and placing stops.
In this article, we will explain what moving averages are, types of moving averages, and some of the best strategies to use.
What are Moving Averages?
Moving Averages (MAs) are some of the best technical tools to use to make trading decisions. Indeed, they are so popular that they are the foundation of most technical indicators like Bollinger Bands, Envelopes, Average Directional Movement Index (ADX), and MACD, among others.
Moving averages map the average price of an asset in a certain period of time. There are several types of moving averages.
- Simple moving average (SMA) – SMA, the most common type of MAs calculates the average price of an asset by the number of periods in that range.
- Exponential moving average (EMA) – The EMA removes the lag in SMAs by prioritising the recent prices.
- Weighted moving averages (WMA) – The WMA removes the lag by discounting the weight of the ‘ancient’ prices of an asset.
- Smoothed moving averages (SMA) – The smoothed moving average removes the lag by using a longer period to determine the average. It assigns a weight to the price as the SMA is being calculated.
There are other types of moving averages like the least squares moving averages, hull moving average, and Arnaud Legoux moving average. The chart below shows how the 25-day EMA, SMA, and WMA applied on the Nasdaq 100 index.
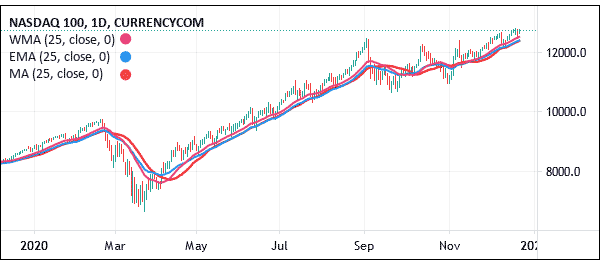
Types of moving averages
Simple moving average (SMA)
The SMA indicator is the most popular type of moving average in the market. It is the core of moving averages in that it is calculated by adding the asset price in a certain period and then dividing the total by the periods.
While the SMA is a good one, it has its own challenges. The biggest con is that it takes all periods equally. For example, when calculating the 200-day moving average, all days are taken equally. As a result, it might not reflect the most recent happenings in an asset.
The SMA, like other moving averages, is used to identify an asset’s trend, key support and resistance levels, reversals, and stops.
Exponential Moving Average (EMA)
The EMA removes the lag that exists in the Simple Moving Average (SMA). It does that by putting a priority in the most recent data. As such, in a 200-day EMA, the recent data tends to have more weight compared to the one that happened 200 days earlier.
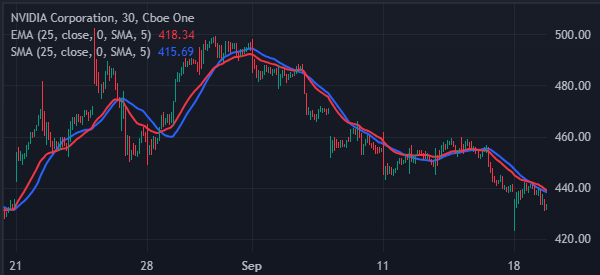
It achieves this by first calculating the SMA and then finding a multiplier. The final stage is where you calculate the EMA using the multiplier figure. As shown below, the EMA in red is more reactive than the blue SMA.
Weighted Moving Average (WMA)
Like the EMA, the Weighted Moving Average aims to reduce the noise that exists in the simple average. It does this by also putting more weight on recent data. This is done by multiplying each bar’s price by a weighting factor. The formula for this calculation is as shown below. In this case, P1 is the current price while P2 is the price one bar ago.
WMA = (P1 * 5) + (P2 * 4) + (P3 * 3) + (P4 * 2) + (P5 * 1) / (5 + 4+ 3 + 2 + 1)
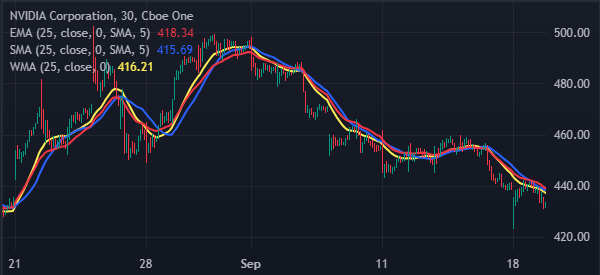
Again, as you can see below, the WMA tracks the price more closely than the EMA and SMA. As such, it can deliver better signals.
Smoothed Moving Average (SMMA)
Like the EMA and VWMA, the goal of the SMMA is to reduce the noise that exists in the SMA. It is a type of EMA in that it applies for a longer period.
In this, it gives the recent prices an equal weighting to the historic ones. It does not refer to a fixed period but rather takes all the available data series into account.
Volume Weighted Moving Average (VWMA)
This is a type of MA that incorporates both asset prices and volumes. Volume is an important part of the market since it shows the weighting The VWMA is calculated using the following formula: Sum of (closing price x Volume) / Sum of Volume.
The other types of moving averages are:
- Least Squares Moving Average (LSMA) – The LSMA is a type of MA that minimizes the effect of price outliers. It is calculated using the least squares regression method.
- Arnaud Legoux MA – This MA reduces the challenges that other MAs have by calculating each moving average simultaneously.
How to read the moving average
Reading the moving average is a relatively simple process. The first step to read moving averages is to identify the type of MA to use. Some traders focus on the Simple Moving Average while others use the VWMA, EMA, and Weighted Moving Average.
The next stage is to find the period to use. Ideally, a short-term MA like a 15-MA reacts to a price movement faster than a longer average. In most cases, day traders focus on short-term charts. Investors who buy and hold assets for a long period tend to use longer averages like 50-day and 200-day.
The next stage is to just look at the chart and identify where it is. In most cases, when the price has been in a tight range for a long time, it will oscillate at the moving average. If the price is rising, there are chances that the price will be above the moving average, and vice versa.
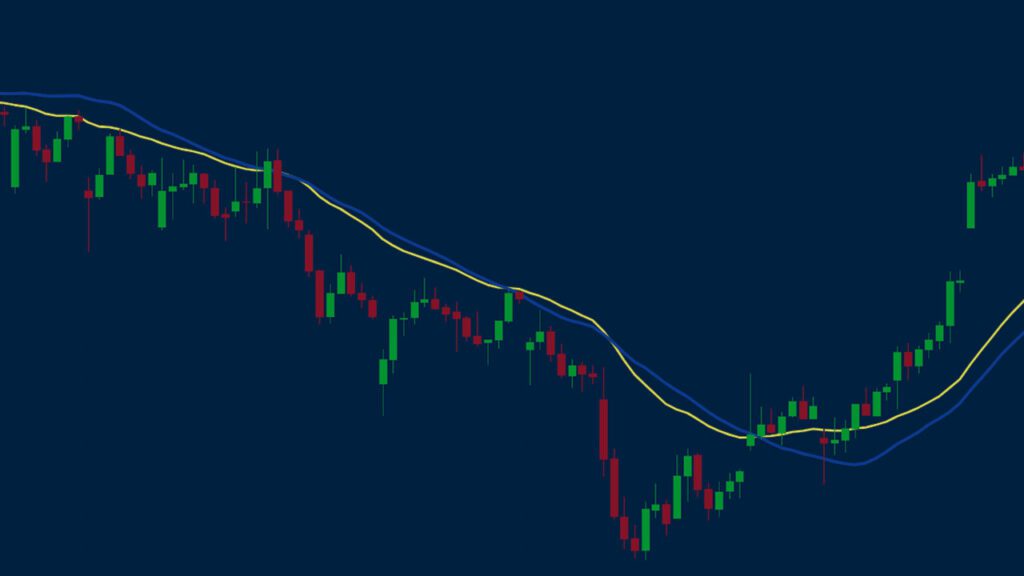
In the chart below, a trader would have placed a buy trade as long as it was above the 50-day moving average. They would either exit or even place a short trade when it moved below the 50-day MA.
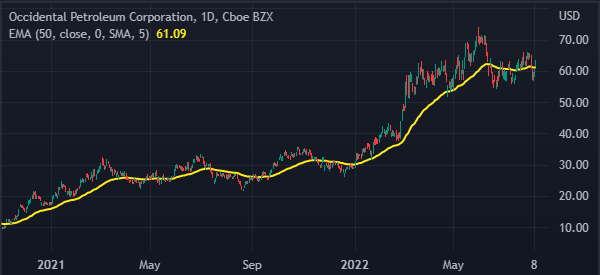
In a highly volatile market, the price will move above and below the moving average. In this period, the moving average will often give you false signals.
Which is the best MA for day trading?
As mentioned, there are numerous types of moving averages. Therefore, a common question is on the best type of moving average to use in trading. Some traders focus on the simple moving average while others believe in the EMA or the VWMA.
We recommend using the EMA or the VWMA. The VWMA is a good indicator because it incorporates both the asset price and the volume. At the same time, the EMA is a great indicator because it is more reactive to the current asset price.
Regardless of the moving average you use, the strategies will always be the same. You can use them in trend-following, reversals, and to identify support and resistance levels.
Best MA for a 15-minute chart
A 15-minute chart is usually used by day traders, who are more focused on opening a trade and closing it by the end of the day. It is never ideal for swing and long-term traders to use a 15-minute chart.
Therefore, the best MA to use in a 15-minute chart should be relatively short. For example, it does not make any sense to use a 100-period MA on a 15-minute chart. It also does not make sense to use a 50-MA for such a chart.
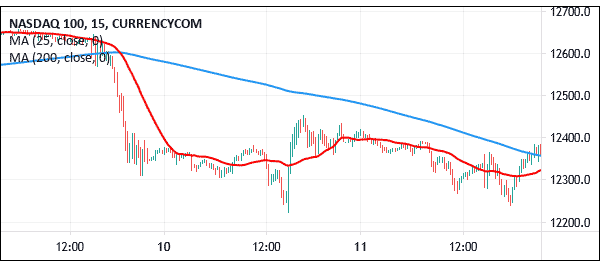
Instead, you should use relatively shorter-dated moving averages. For example, the chart below shows the 15-minute chart of the Nasdaq 100 with a 200-period and 25-period EMA.
You should use the 50-day, 100-day, and 100-day moving averages when you are looking at long-term scenarios. For example, when you want to buy and hold a security for two weeks or a month, you should use a longer-term moving average.
Similarly, if you are looking at short-term situations, you should look at shorter-term moving averages.
Strategies for Moving Averages
There are numerous moving average strategies to use in the market.
Identify entry and exit levels
The first important strategy to use moving averages is to identify entry and exit levels. This strategy starts with identifying the best MA to use. You could select the EMA, VWMA, and Smoothed Moving Average.
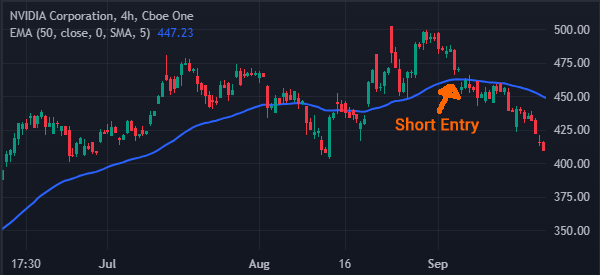
The next step is where you identify the right period to use and add then apply the moving average to the chart. The chart below shows that the Nvidia stock price retreated below the 50-period moving average.
This makes it a good entry point for a short-seller. It is also a good price to exit a long trade.
Moving average crossover
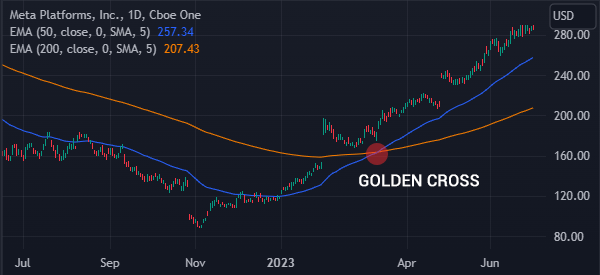
The other popular moving average strategy is known as the crossover. Broadly, the most popular crossovers are the Golden Cross and Death Cross.
A golden cross happens when the 50-day and 200-day moving averages make a crossover when pointing upwards. It signals that buyers. The chart below shows how a golden cross pattern works.
However, for most day traders focus on short-term charts like 5 minutes and 15 minutes. In this case, using the 200-period and 50-period might not be ideal. As such, they use shorter timeframes like 25-period and 15-period.
Trend-following
Trend-following is a trading strategy where you identify an existing trend and then follow it to the end. The goal is to take advantage of the trend and follow it well.
In this case, you place a buy trade as long as the price is above the moving average and hold it until it moves below the average.
Moving average S&R levels
The other approach for using the moving average is to identify support and resistance (S&R) levels. Support is seen as a floor where the price struggles to move below while resistance is seen as the ceiling.
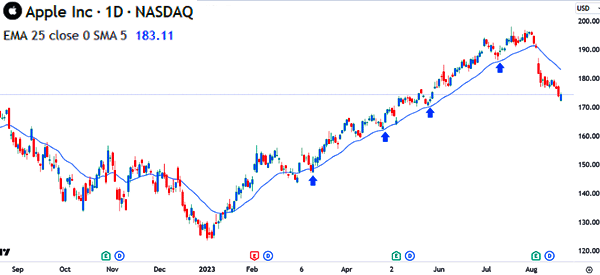
The chart below shows the moving average (25-day) used to identify the support levels of the Apple Shares.
Moving Averages Tips: How to master them
#1 – Proper Period
The first thing you need to master the skills of moving averages is the period. In trading, you can trade charts on various timelines. It is possible to trade one-minute charts up to yearly charts. Each of these charts require different types of analysis.
Related » Best time-frame for day trading
A person who looks at annual or monthly charts is probably a long-term investor who wants to open trades and leave them to run for a certain period of time.
As a day trader, it is irrelevant to use these charts. As such, an investor should use long term periods. In this, the commonly used period is 200 days.
A day trader will aim to enter a trade and exit within a few minutes or hours. To do this, the trader needs to have a short term chart between 5-minutes and one-hour. Then, the period used should be short as well. The most commonly used periods are 12 and 24.
Related » A Guide to Multi-Time Analysis
#2 Combine moving averages with chart patterns
The other trading strategy for using moving averages is to combine them with chart patterns. There are many chart patterns like triangles, head and shoulders, rising and falling wedges, double-top, and rectangles.
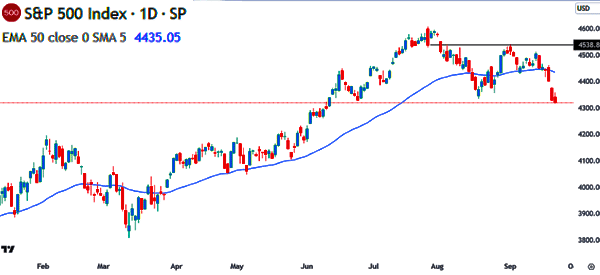
Moving averages can be used to confirm several price actions. For example, in the chart below, we see that the S&P 500 index formed a double-top. This price action was confirmed when it moved below the 50-day moving average.
#3 – Combine MAs with other indicators
Moving Averages are trend indicators, so they show a trader whether a trend has formed or not. To make efficient decisions, it is important to combine these MAs with other technical indicators. By combining two or three indicators, it will help you make better decisions.
A good strategy is to combine MAs with volume-based indicators, and oscillators. Personally, we suggest combining MAs with stochastics, Relative strength index (RSI), and accumulation/distribution.
You should strive to combine MAs with only a few indicators because doing so with many indicators will hamper your decision making. It is also important to always look at the fundamentals of any asset that you want to buy or sell.
On a daily basis, economic data is released. You should use this information together with the moving averages to make prudent financial decisions.
#4 – Combine Two Moving Averages
Another strategy that has been very important to me is to combine two moving averages in the same chart. In this, you combine a long-term MA (slow) and a short term MA (fast).
For instance, in a 15-minute chart, you can have a 14-day exponential moving average and a 5-day EMA. After this, you should look at the areas where the two lines cross.
If the fast EMA crosses the slow EMA going up, then this is an indication of a bullish chart. The vice-versa is true too.
#5 – Create a System
Another strategy that will help you make more from the moving averages is the use of a trading system. Expert Systems as they are known can be very helpful to you.
In the past, creating an EA required one to have a strong background in statistics and computer science. Today, various brokers provide a drag and drop platform for creating expert systems.
When creating an expert system based on moving averages, you should have your parameters right and then put them in the system (as stated above, you can combine the Mas with other indicators).
Finally, you should implement the system in your charts so as to get signals when the points are reached. Before implementing it, you should do a lot of backtesting to ensure the system is accurate.
Related » How to develop a Mechanical Trading System
External Useful Links
- Read more about MA on Investopedia
