Technical indicators are very essential for traders and investors. Moving Averages, MACD, and the Relative Strength Index (RSI) are some of the most commonly used indicators.
Volume on the other hand is one of the most underrated indicators partly because of its simplicity. However, the fact is that volume is the most important indicator because of its underlying principle.
In a normal market, the price of commodities moves because of supply and demand. When the demand of a product exceeds the supply, it results in a higher price. On the other hand, when the supply exceeds the demand, the price of the commodity comes down.
The financial market works in the same way.
For instance, when there is a huge demand for dollars, its price against the purchasing currency will go high. According to Anna Couling, author of the best-selling book A complete guide to volume price analysis, noted that traders who focus primarily on volume achieve more in their trading than their counterparts who ignore it.
This is because volume represents the total number and value of transactions during a particular time. The chart below shows a 10-year Google chart with the average section at the bottom.
Notice how well the volume indicator reflects the price (better with a candlestick chart).
What is volume analysis?
Volume analysis is a method used in technical analysis to study the trading volume of an asset, such as stocks, currencies, or commodities.
It focuses on analyzing the number of shares or contracts traded during a specific period. The underlying idea is that volume can provide important insights into the strength and sustainability of price movements.
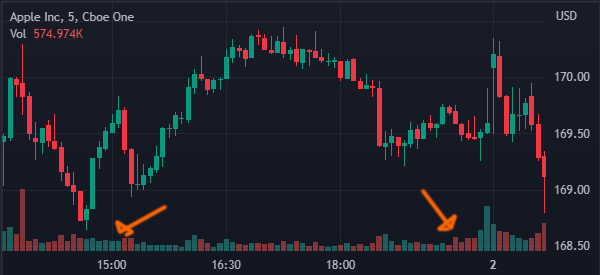
- High Volume and Sharp Price Movement: When an asset experiences a significant price increase or decrease accompanied by a high trading volume, it suggests that there is strong conviction behind the move. High volume validates the price action, indicating a higher level of market interest and participation. Traders often interpret this as a more sustainable trend.
- Low Volume and Price Movement: Conversely, when an asset moves up or down with low trading volume, it raises concerns about the reliability of the price move. Low volume signals a lack of enthusiasm or interest from market participants, and such price movements are considered less reliable.
Accumulation and Distribution Phases
Accumulation and distribution are two distinct phases that appear on price charts and are closely related to volume analysis. These phases represent shifts in the sentiment of market participants.
Accumulation Phase. This phase occurs after a prolonged downtrend when the asset’s price is at or near its bottom. During the accumulation phase, informed investors and institutions start buying the asset at relatively low prices.
The trading volume may not be very high initially as the asset is still undervalued and not widely favored. However, as the price starts to recover and more participants recognize the potential for an uptrend, trading volume increases.
The accumulation phase is characterized by smart money buying positions, and it lays the groundwork for the next bullish trend.
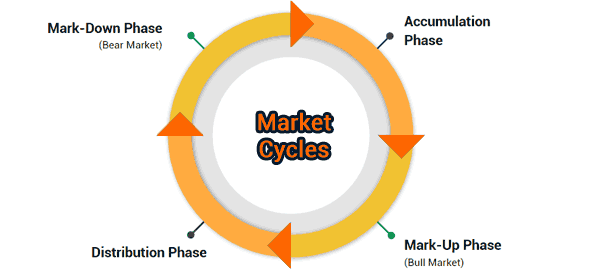
Distribution Phase. This phase occurs after a sustained uptrend when the asset’s price is at or near its peak. During the distribution phase, informed investors and institutions begin selling their holdings to take profits.
The trading volume may not be very high at the beginning of this phase, as the general market sentiment remains positive. However, as selling pressure intensifies, volume increases.
The distribution phase marks the end of the uptrend and signals the potential for a downtrend.
Why volume price analysis is so important
To traders and investors, volume is very important for two main reasons: shows the psychological level of traders and is a good tool to use to check or confirm a trend.
For instance, when the price of an asset is moving up with a high volume, it indicates that the trend is stronger, therefore creating a bullish signal.
On the other hand, if the volume of the asset is moving down with a high volume, it indicates a sell-off.
Volumes are also important indicators of divergence. A divergence is always evident when an increase in volume in an upward trend leads to the reduction in price of the asset.
The key principle when doing volume price analysis is that a price drop on large volume shows that something might have triggered the move.
This ‘something’ could be a news or economic release such as the non-farm payrolls or an interest rate decision.
Traders also use volume as a way to confirm chart patterns. Some of these patterns are:
- Head and shoulder
- Triangles,
- Flags
Experienced or successful traders when identifying and confirming these chart patterns always refer to the volumes. For example, if the volume of an asset is high, chances are that it will confirm the formation of these chart patterns.
In this, the VWAP can give you a big hand.
Indicators to analyze volume
On-Balance Volume
This strategy was developed by Joseph Granville who is regarded as an important figure in technical indicators. It is an important indicator which is based on whether prices of assets close higher or lower in the previous day.
The indicator rises or falls before the actual prices of the assets are indicated.
When using on-balance volume, a new high is a representative to the power of the bulls and weaknesses in the bears leading to a buy opportunity.
On the other hand, a new on-balance volume low is representative of a bear market.
Finally, when on-balance volume shows a signal that differs with the actual prices, it shows a shift in price or divergence.
Accumulation/Distribution (A/D)
This is another very important volume indicator which takes into account the opening and closing prices of assets.
When the Accumulation/Distribution indicator shows a positive number, it is an indication that the prices were higher than when they opened. When the figure is negative, it shows the opposite.
A wide range between the opening and closing price is an indicator that the AD is strong.
However, it is very important to look at the patterns of the A/D highs and lows. This is because when a market opens higher and closes lower, it represents a lower upward-trending market.
For a day trader, volume is very important as a key psychological indicator. It shows when traders in the market are fearful (leading to a sell off) and when they are bullish (leading to a price hike).
However, at some instance, the volume of an asset will go up before a sell-off happens leading to a sharp diversion. In these instances, it is very important to combine the volume indicators with other technical and fundamental indicators.
VWAP
The Volume Weighted Average Price (VWAP) is another popular volume indicator to use. As the name suggests, the indicator looks at the average price in relation to volume of an asset.
The VWAP indicator has a close resemblance to a moving average and the two are used in the same way.
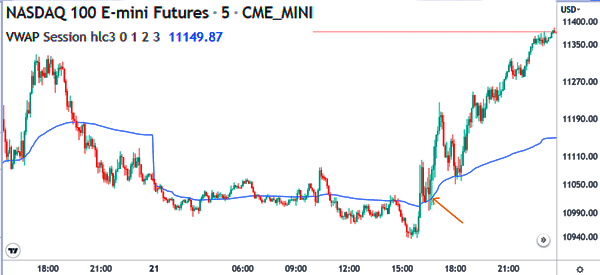
A key difference is that the VWAP is only used in intraday charts while moving averages can be used in all timeframes. In most cases, traders buy an asset when it is above the VWAP and vice versa.
VWMA
The Volume Weighted Moving Average (VWMA) is a technical indicator that is commonly used by day traders and investors. It is a variation of moving averages, with the difference being that it incorporates an asset’s volume.
Therefore, since the VWMA is a type of a moving average, it is used in a similar way to other MAs.
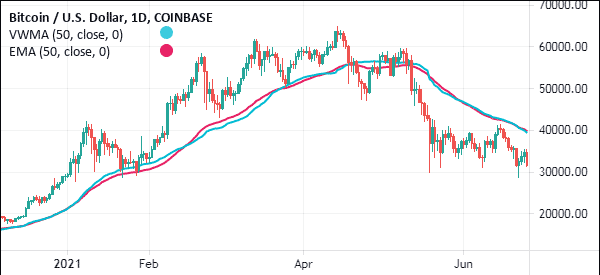
For example, you can buy when the asset moves above the VWMA and short when the vice versa happens. Also, you can decide to buy when the short and longer-term VWMA indicators make a crossover.
Negative Volume Index (NVI)
The NVI index is an indicator that incorporates volume and the price of an asset. Its goal is to compare an asset’s price movement with the volume.
It assumes that the smart money will produce moves in price that require less volume than the rest of the crowd. The indicator rises on positive days when the volume is low and vice versa.
The positive volume index is the exact opposite of the NVI indicator.
Summary
Volume is an important aspect of day trading in that it helps traders make good decisions. In this article, we have looked at why volume matters and some of the most popular indicators you can use.
External useful resources
- Volume Analysis in Day Trading – The Balance
