Moving average is the most common technical indicators in the trading world. If you watch financial television or read financial content, you have likely heard the commentators and analysts talk about it.
We have covered moving averages in the past. In our past article, we guided you on how to calculate the averages and how to use them in the market.
In this article we also want to introduce the concept of volume applied to MAs, for this we will talk about VWMA (Volume Weighted Moving Average).
The concept of Volume in Trading
Volume is another important concept in the financial market. Traders use this concept to identify the strength of a trend. In her book, A complete guide to volume price analysis, Anna Couling writes that volume is the key foundation to any trader’s success.
A good way to look at this is to consider an example of a stock. The stock price of company A can soar by 20% today. If this price action is not supported by most traders, the price will mostly come back lower in the following day.
What is the VWMA, Volume Weighted Moving Average
In this report, we will look at the volume weighted moving average (VWMA), an indicator that combines the concept of moving averages and volume. We will look at how it is calculated and how you can use it in the market (and strategies, sure).
How it is Calculated
In our previous article on moving averages, we found that the process of calculating a simple moving average is relatively easy. You just take the closing prices of an asset, add them, and then divide by the number of periods.
The volume weighted moving average is relatively different because it considers the volumes.
Here are the steps you have to follow:
- First, you need to calculate the typical price of an asset in a day. You do this by adding the asset’s highest, lowest, and closing level, and then divide the number by three.
- The second step is where you multiply the answer you got in the first step by the period’s volume. You then do this for all the periods that you are covering. After this, you add these values, which is known as the cumulative total.
- In the next step, you add the total volume and in the final step, you divide the running total price and the volume.
VWMA Formula
In summary, you can calculate the VMWA using the following formula.
| VMWA = (C1*V1 + C2*V2 +C3*V3) / (V1 +V2+V3) |
This is a VMWA for a three-day period.
As you can see, the process can be relatively long. However, as we have always mentioned, you don’t need to learn about this. As a trader, your goal should always be focused on learning about how to use the indicator.
VMWA strategy: how to trade with this indicator
The VMWA is used in a similar way to the normal moving average. There are many ways of using the VMWA. However, our best strategy is one that combines a longer and a shorter-dated VMWA. By combining the two, you are able to identify good entry and exit positions.
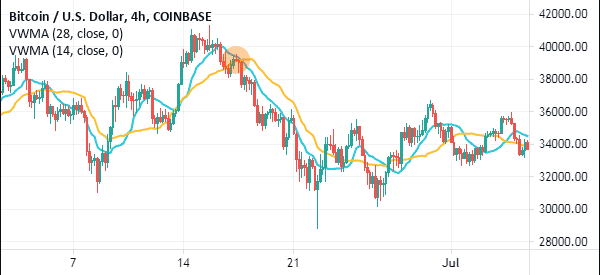
When you combine a shorter and a longer-period VMWA, you should watch out for where they crossover (if You don’t know what crossovers are, here is our guide). When the price is in an uptrend and the shorter and longer-term VMWAs make a crossover, it is usually a signal to sell. The vice versa is also true.
A good example of this is shown in the chart below. As you can see, a signal to short Bitcoin emerged when the 28-day and 14-day VWMA made a bearish crossover.
Using VWMA to follow the trend
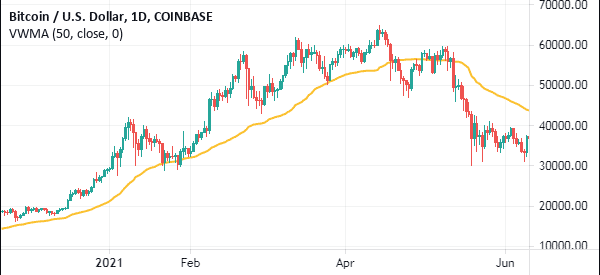
VWMA, like all other types of moving averages, can be used to follow the trend. This is where you add the indicator and use it to predict when to exit. Many traders use different periods for this but We prefer using the 50-day WMWA.
For example, in the chart below, we see that the Bitcoin price is in a bullish trend. As it rises, the currency remains above the 50-day VWMA. In this case, traders continue holding their positions as long as it is above this average. An exit point emerges any time the coin moves below the indicator.
VWMA vs VWAP
The Volume Weighted Moving Average (VWMA) is often confused with the Volume Weighted Average Price (VWAP). While the two names look the same, they are created and used differently. The chart below shows the price of Bitcoin with a 20-day VWMA (black) and a VWAP (blue).
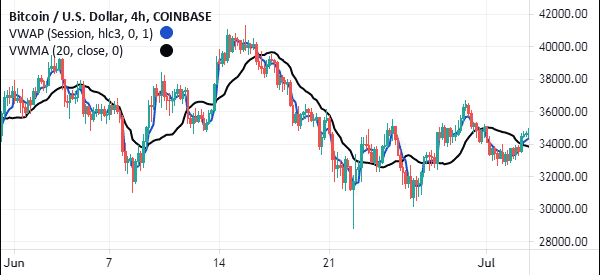
The biggest difference between the two is that VWAP is only ideal for day traders since it resets every day. Traders use the tool to guide them on whether the current price is above or below the average price.
As we have seen before, VWAP is calculated by first getting the Typical price by adding the high, low, and closing and then dividing it by three. You then use the formula below to calculate it.
VWAP = Cumulative(Typical Price x Volume)/Cumulative (Volume)
The VWMA, on the other hand, is a type of moving average that incorporates volume in its calculation. As seen above, you simply find the simple moving average and then add volume into the equation. As such, you can use the VWMA in a similar way that you use other types of moving averages.
VMWA vs EMA
The VMWA and the exponential moving average are different in how they are calculated. For one, VMWA uses the simple moving average and volume.
On the other hand, the EMA is a type of moving average that reduces the noise by putting more emphasis on recent data. For example, if you are calculating the EMA of a 20-day period, you should start putting more emphasis on today going backwards.
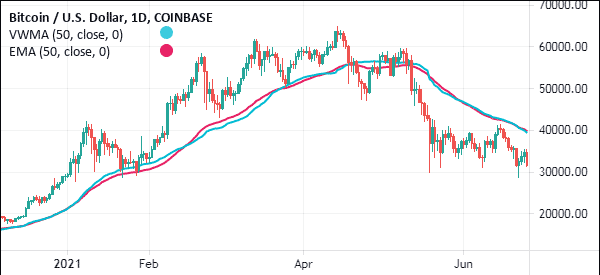
Still, the two look the same when they are applied on a chart. Traders also use the two in a similar method. The chart below shows a chart with the 50-day EMA and a 50-day VMWA.
VMWA vs MVWAP
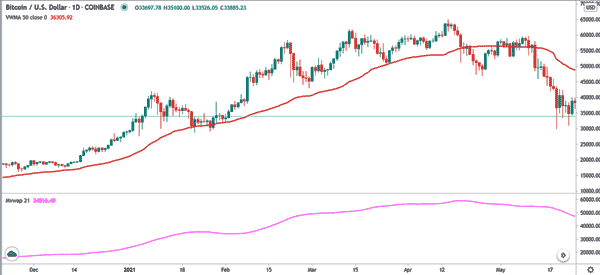
VMWA and the Moving Volume Weighted Average Price (MVWAP) are significantly different indicators. While VMWA is a trend indicator, MVWAP is an oscillator. The latter is calculated by looking at the weighted average price of an asset and adding concepts of volume.
The chart below shows the two indicators applied on a chart.
Advantages of the Volume Weighted Moving Average
There are two main advantages of the VMWA. First, the indicator is very easy to use as you can see above. Second, the indicator improves the moving average, which is a popular indicator by introducing volume.
The main disadvantage is that it is not found in most trading platforms. As such, you must download it and install manually, which is a difficult thing to most people.
Summary
VMWA is a great indicator to use to identify reversals and confirm a trend. As a trader, we recommend that you take time to learn how the indicator works. Also, we recommend that you take time to practice more using a stock market simulator before you use it in your live account.
