Chart patterns play an essential role for traders using both technical analysis and price action-related strategies. In the past, we have covered several chart patterns such as triangle, engulfing, and morning star, among others.
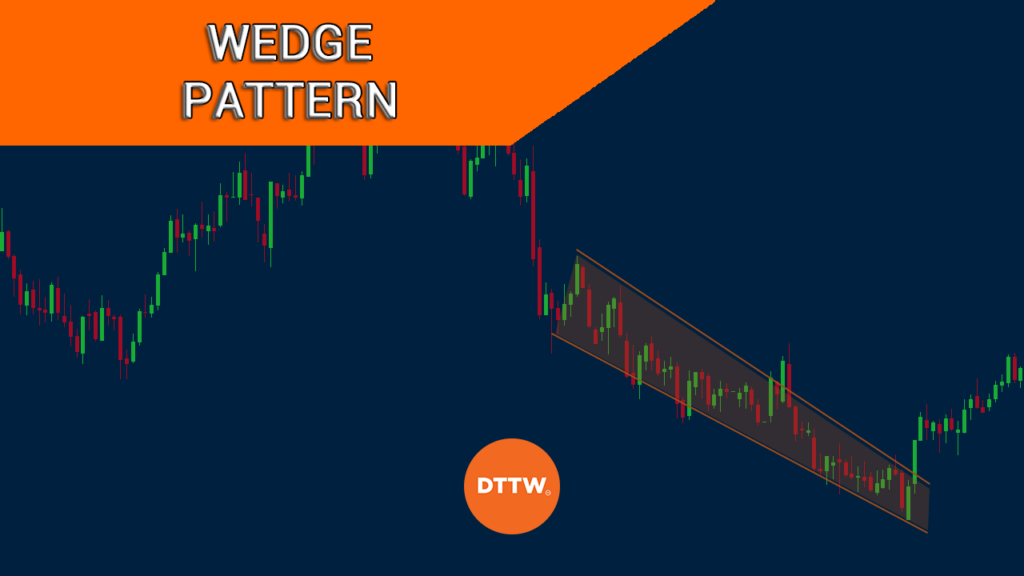
In today’s report, we will look at another interesting pattern known as the wedge pattern and how you can use it in the financial market.
What is a wedge pattern? Falling & Rising Wedge
A wedge pattern is a triangular continuation pattern that forms in all assets such as currencies, commodities, and stocks. Unlike other candlestick patterns, the wedge forms within a longer period of time, between hours and days.
There are two types of wedge patterns, which include falling and rising wedge.
A falling wedge is simply defined as a continuation pattern that is formed when a price fluctuates between two downward sloping and converging trendlines.
A rising wedge, on the other hand, is a bullish chart that happens when the fluctuates between two upward sloping and converging trend lines.
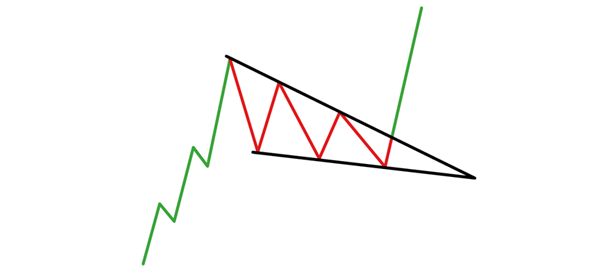
The two wedges are usually seen as bullish and bearish, respectively. The chart below shows how a falling wedge looks like.
Related » Triangle Pattern in Day Trading
Wedge patterns and divergences
Wedges are closely related with divergences. For starters, divergence happens when an asset’s price is rising while oscillators like the Relative Strength Index (RSI) and the MACD are falling.
A bullish divergence pattern, on the other hand, happens when an asset’s price is falling while oscillators are falling. In the same way, a rising wedge usually leads to a bearish breakout
How a falling wedge happens
A falling wedge happens when several things happen. First, the price of an asset needs to be in a strong upward trend.
As the price rises, it reaches a point where bulls start raising doubts about how high it can go. As a result, some starts to sell and take profits, which pushes the price lower.
As the price drops, some bulls start coming in but then exit after a while. All this creates a pattern that looks like a descending triangle pattern. As it reaches its tip, the price then breaks out higher and continues with the upward trend.
Practical Example
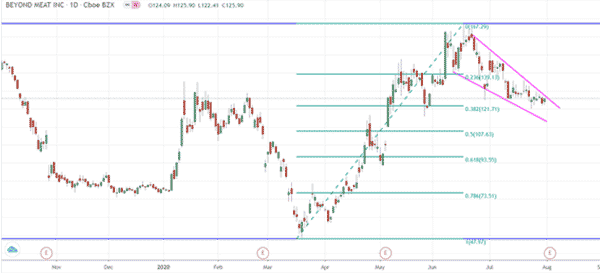
The chart below shows the stock price of Beyond Meat, a popular company that is disrupting the meat industry.
As you can see, the price of the stock bottomed at $47.97 on March 19. It then stared a bull run but it found significant resistance at $167 on June 17. Since then, the stock has been forming a falling wedge pattern.
Interestingly, the bottom of the wedge happened at the 38.2% Fibonacci retracement level at around $120. Therefore, while the wedge is still being formed, there is a possibility that the Beyond Meat price will continue rising as bulls target the previous high of $167.
How a rising wedge pattern happens
A rising wedge, on the other hand, is the exact opposite of the falling wedge pattern. It forms when the price of an asset is in a sharp decline.
It then finds some resistance as bears start to take profits. And as they do this, the price forms what usually appears to be an ascending triangle pattern. A rising wedge is usually a bearish indicator.
How traders can use the rising wedge pattern
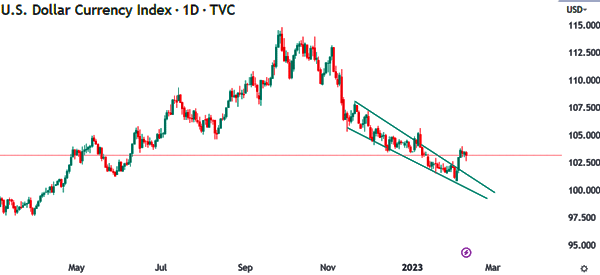
The main method to trade the rising wedge pattern is to known as reversal. The idea behind this is simple. When you spot a rising wedge, you simply wait until it nears its confluence level. This is where the two lines attempt to meet. In this case, the price will likely have a bearish breakout.
The same situation happens when using the falling wedge. You simply wait for the two lines to reach its confluence point. When this happens, the asset will likely have a bullish breakout, as you can see in the chart below.
Pro tips to use wedge patterns
There are several tips for you to use the wedge pattern. Some of the top ones are:
- Be aware of false breakouts – It is always recommended that you wait for a while before you execute an order. Doing so will help you prevent being caught up in a false breakout.
- Profit target – Another tip is to measure the distance of the upper and lower sides of the wedge pattern. In this, your profit target will likely be the same distance.
- Fibonacci retracements – Always use the Fibonacci Retracement and Andrews Pitchfork tools when trading with wedges. They will help you identify key take-profit and stop-loss levels.
- Incorporate volume – Volume is an important part of trading rising and falling wedges. In most periods, if a bullish breakout with limited volume, it is usually a sign of a false breakout.
- Indicators can help – At times, technical indicators like moving averages and Bollinger Bands can help you know when a breakout is happening.
Wedge Pattern: Benefits..
The wedge pattern is a popular pattern to use when trading the financial market. It is also one of the most accurate. There are several benefits of using the pattern.
- It is easy to use – As you can see above, it is relatively easy to use the wedge pattern.
- Easy to use with other tools – You can easily use the pattern with other tools like the Fibonacci retracement.
- It is accurate – While it is not 100% accurate, the wedge pattern has a high degree of accuracy.
- All assets – You can use the wedge pattern to trade all assets such as bonds, stocks, and commodities.
…and Cons
While the wedge pattern is an excellent price action chart to use, it also has some of its cons. Some of these are:
- It takes a while to form – The wedge pattern takes a few hours or days to develop.
- It can be confused with other patterns like pennants and flags by novice traders.
Final thoughts
Price action is one of the best-known day trading strategies in the market. In previous articles, we have looked at some of the most popular price action trading strategies in the market.
If you are a new trader, we recommend that you spend a lot of time learning and applying them in a demo account.
External useful Resources
- How to Trade Wedge Chart Patterns in Forex – Babypips
