Technical indicators are essential tools that help traders predict the future price of financial assets. These indicators are created using complex statistical formulas.
In the past few weeks, we have focused on sharing our knowledge on some of the common technical indicators like the Relative Strength Index (RSI) and Bollinger Bands. We have also focused on some relatively unknown indicators like the Keltner Channel and the Donchian Channel.
In this report, we will look at the essentials you need to know about the William Alligator Indicator in Day Trading.
What is the Alligator Indicator?
The Alligator indicator is one of the several indicators that were developed by Bill Williams. Other indicators he has created are accelerator oscillator, fractals, gator oscillator, and the market facilitation index.
He developed the alligator in 1995 when he wrote his book, Trading chaos: Applying Expert Techniques to Maximize Your Profits. Bill Williams’ indicators are built-in in most trading platforms like the MetaTrader.
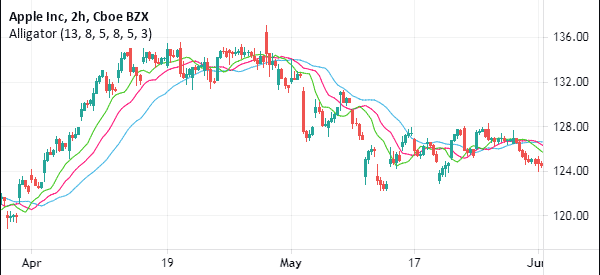
When applied, the Alligator indicator has three lines. In default, the three lines are in red, blue, and green. The red line is known as the teeth while the blue line is the jaws. The green line is known as the lips. The chart below shows the Williams Alligator applied in a Microsoft chart.
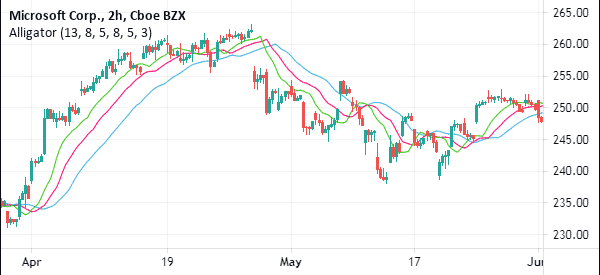
But..what exactly do these terms mean?
The jaw is the 13-period smoothed moving average that is moved into the future by 8 bars. The teeth is the 8-smoothed moving average that is moved five days into the future while the lips is the 5-period smoothed moving average that is moved by 3 bars into the future.
The smoothed moving average is a type of MA that uses a longer period to compute. When it is calculated, it does not refer to a fixed period but takes all available data into account. You calculate this by subtracting the previous SMA from today’s price.
Other types of moving averages are simple, exponential, and weighted.
How to interpret and Read the William alligator
To interpret the William alligator, the first thing you need to do is to understand what the three lines mean. As mentioned above, the three lines are the smoothed moving averages (SMA) of different periods.
Therefore, since it takes into account moving averages of an asset, it is easy to interpret the indicator.
The simplest way to look at it is when the three lines of the indicator are below the price. This is usually known as eating with the mouth open. When it happens, it is usually a sign that the price will continue rising. A good example of this is shown below.
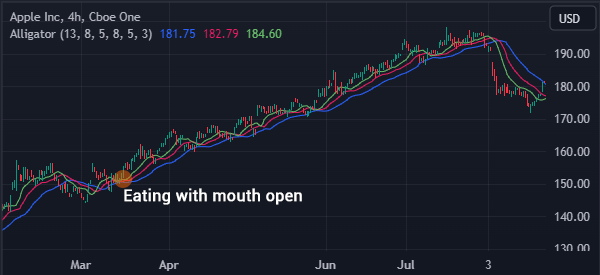
This means that you should always focus on when the three lines make a crossover. A bullish trend is confirmed when the price is above the three lines.
Look for Trends
Using the alligator indicator is relatively easy. First, you need to look at a chart that is either trending upwards or moving downwards. It is wrong to use it when the price of an asset is consolidating.
Indicator’s Numbers
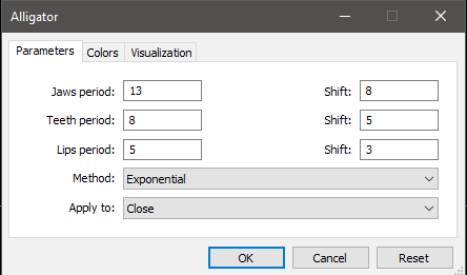
The next step is to look at the numbers that are in the indicator. The default periods for the jaw, teeth, and lips periods are 13, 8, and 5. The other important numbers to look at are the shifts.
The default shifts in the jaws, teeth, and lips are 8, 5, and 3.In simple terms, these shifts are the periods that are moved into.
Method
After this, there is the method. The default method is usually smoothed. You can change this to simple, linear weighted, and exponential.
Finally, you need to check where you want to apply these numbers. This can be either the close, open, high, low, median, weighted close, and typical close. We recommend that you use the default figures as shown below.
Identifying Market States
The Alligator Indicator is not just a tool for identifying trends; it also provides valuable insights into the current state of the market.
Bill Williams introduced the concept of three distinct market states that the Alligator can help traders identify: Sleeping, Awakening, and Eating phases.
Sleeping Phase
During the Sleeping phase, the Alligator’s three lines (Jaw, Teeth, and Lips) are tightly intertwined and move horizontally in close proximity to each other.
This phase indicates a period of low volatility and indecision in the market. Prices tend to consolidate, forming a tight trading range.
Traders should exercise caution during the Sleeping phase and avoid making significant trading decisions, as breakouts or trend reversals are less likely to occur.
Awakening Phase
The Awakening phase occurs when the Alligator’s lines begin to spread apart, with the Jaw line at the bottom, followed by the Teeth, and then the Lips on top.
This spreading of the lines signifies that the market is starting to wake up from its consolidation phase. Volatility increases, and price movements become more pronounced. Traders should be on the lookout for potential trend developments during the Awakening phase.
Breakouts from the previous range-bound conditions are more likely to happen, offering trading opportunities in the direction of the emerging trend.
Eating Phase
In the Eating phase, the Alligator’s lines are fully spread apart, with the Jaw, Teeth, and Lips in ascending order from bottom to top. This phase reflects a well-established trend in the market.
Prices are moving decisively in a particular direction, and the trend is strong. Traders can use the Eating phase to ride the trend, entering positions in the direction indicated by the Alligator’s lines. This phase is where traders aim to maximize profits as long as the trend remains intact.
Why they are crucial
Understanding these market states is crucial for traders because it helps them adapt their strategies to the current market conditions. For instance:
- During the Sleeping phase, traders may opt for range-bound strategies or remain patient until the market shows clearer directional signals.
- In the Awakening phase, traders can prepare for potential breakouts and look for entry points in the direction suggested by the Alligator.
- In the Eating phase, traders can implement trend-following strategies, such as trendline trading or moving average crossovers, to capitalize on the strong market momentum.
How do you trade an Alligator Indicator?
As mentioned above, the alligator indicator has three lines. As with all indicators with such lines, the most important things to watch are the crossovers. Crossovers are good signs of reversals.
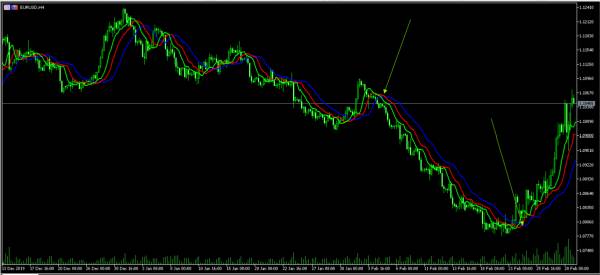
As shown below, the EUR/USD pair reversed its descent when the three periods reversed. A buy signal usually comes when three lines reverses and the jaw remains on the right side.
As the price rises, you should watch as it moves below the green (lips) line.
Alligator in trend-following
Another simple strategy of using the Williams Alligator is in trend following. For starters, this is a simple strategy that aims to buy a financial asset that is rising and a short one that is falling.
As such, in this case, the Williams Alligator will help you identify exit areas. When a financial asset’s price is rising, the bullish trend will remain intact so long as it is on the left side of the indicator.
Similarly, a bearish trend will remain if it is on the right side of the chart. As such, you should start exiting when the price moves towards the lips of the indicator.
This is a similar idea to when you are using the moving average in trend following. An example of this is shown in the chart below.
Alligator and MACD
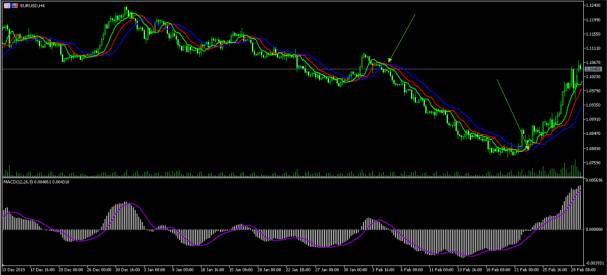
Another way you can use the alligator indicator is to use it together with the MACD indicator. By combining the indicator with the MACD, you reduce the chances of a false breakout.
In this case, a buy signal emerges when the signal line of the MACD moves to the right side of the histograms as shown below.
Using alligator with other indicators
Alligator is a trend indicator and can be used well when an asset is rising or falling. In most cases, it rarely works when assets are in a consolidation phase.
Therefore, you can use it with other indicators like the Relative Strength Index (RSI), Stochastic Oscillator, and Money Flow Index (MFI).
A good example of this is in the chart below.
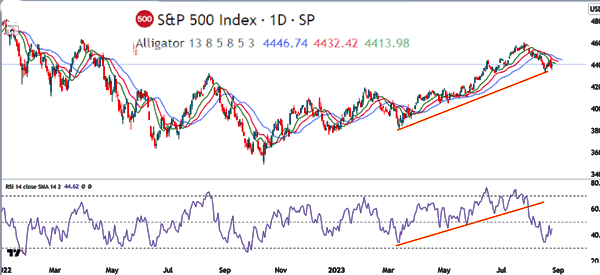
As shown above, the S&P 500 index continued rising as it remained above the William Alligator while the Relative Strength Index (RSI) was above the ascending trendline.
Wait for a breakout
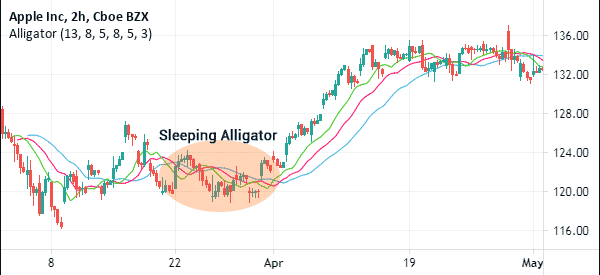
Another strategy for using the alligator indicator is to wait for a major breakout. In a period of low volatility, when the three lines are close together, it is usually a sign that the price will make a major move.
A common analogy is that of using a real alligator. When it sleeps for so long, the hungrier it becomes, and is ready to hunt for bulls and bears. A good example of this is shown in the chart below.
Risk management when using the William Alligator
There are several strategies that traders should consider when using the William Alligator. First, you should always avoid it when the market is moving in a tight range. In such periods, crossovers of the lines will always have false signals.
Second, it is always important to use it in combination with other indicators like the RSI and MACD. Also, use several tools like the Fibonacci Retracement and Andrews Pitchfork.
Finally, always wait for the trend to form before executing a trade. Buying exactly when the crossover happens will often lead to a loss.
William alligator in scalping trading..
Scalping is a trading strategy where a trader buys and exits a trade within a few minutes. It differs from other approaches where traders hold their trades for several hours, days, or weeks.
Scalpers typically use extremely tight timeframes like 5-minutes and even 1-minutes. In most cases, the William Alligator is not a popular one in scalping. Instead, traders tend to use indicators like VWAP and moving averages.
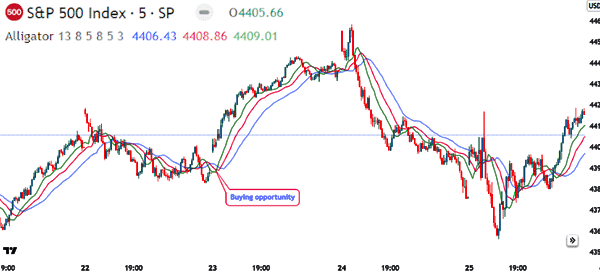
Still, it is possible to use the indicator in scalping. In most cases, buying opportunities emerge when the three lines make a crossover. The lips are usually the inside ones followed by teeth and jaw, as shown below. The exit strategy is triggered when the price crosses the three lines.
.. and in swing trading
Swing trading is a thematic trading strategy that involves buying or shorting an asset and holding it for a few days. It is different from day trading since traders are usually open to overnight risks.
Most swing traders use longer charts like 30 minutes and hourly. Some traders use the four-hour chart. The process of using the indicator is the same. Just add it in a chart and buy when the three lines crossover. Then, hold the trade as long as it is above the jaw, teeth, and lips.
Advantages of Using the Alligator
There are several benefits of using the Alligator indicator, and You don’t need to do the calculations yourself. The indicator is derived from the moving average, which is one of the best-used indicators in the market.
The tool easily integrates with other indicators.It is easy to identify areas of divergences or reversals.
Cons of using Williams Alligator
There are several cons of using the William alligator. First, it is less effective in consolidation markets. In these periods, it is almost impossible to use it when trading. A good example of this is shown in the chart below.
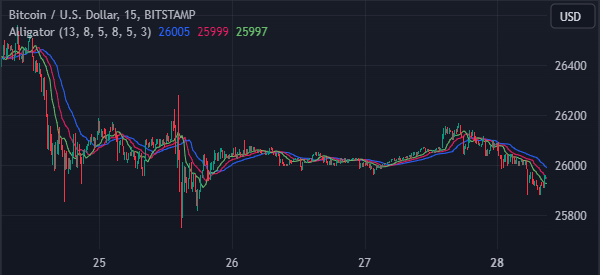
Second, the William Alligator indicator is a lagging one, meaning it tends to provide late signals. Finally, it can provide some false signals at times, especially when the three lines cross each other often.
Summary
The alligator is one of the most popular indicators by Bill Williams. It has colorful names like the jaw, lips, and teeth. As a trader, you should spend time learning about the indicator.
You should also practice and tweak in a demo account the periods to tailor it to your trading strategy.
External Useful Resources
- How do you Trade Alligator Indicator in Forex? – Admiralmarkets
- Alligator Indicator versus the Triple EMA – Tradingsim
