The Williams Fractal indicator, is a relatively unpopular and little-used tool that was developed by Bill Williams, who was a trader and psychologist. He died in 2019 and is widely credited for developing other indicators like the Market Facilitation Index (MFI), Awesome Oscillator, and Gator Oscillator, among others. He proposed the fractals indicator in his book, Trading Chaos.
In this article, we are going to see what the fractal indicator is, when to use it and the pros of using it in a trading chart.
What is the Fractals Indicator?
The Fractals Indicator is based on the concept of fractals geometry and chaos theory. This type of geometry is widely used in the study of chaos and other fields like meteorology, geology, and medicine. He pointed to the fact that fractals are measures of irregularity. When there is a choppy market, the fractal number will be bigger as well.
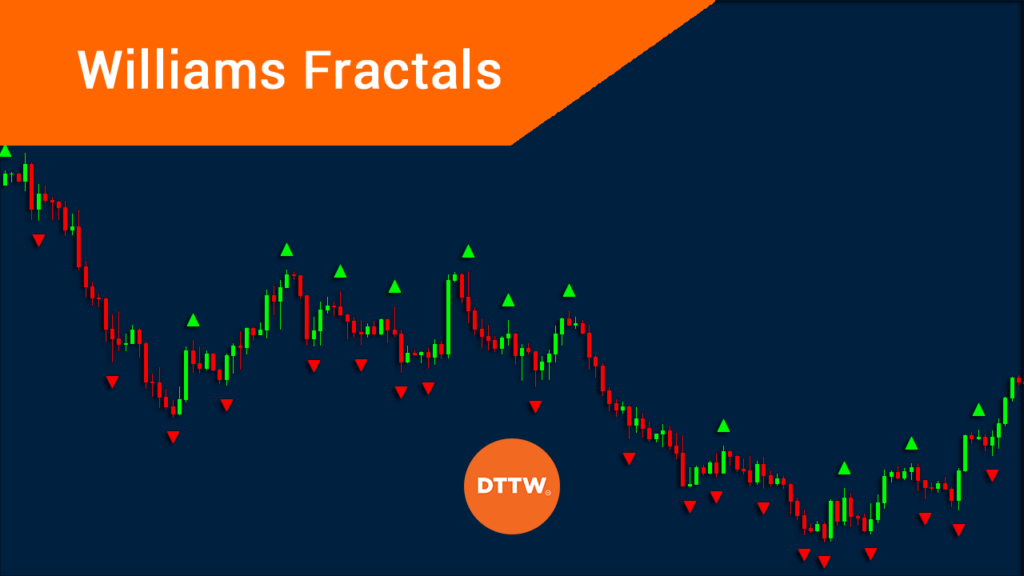
When applied in a chart, the fractal indicator is usually represented as geometric shapes above and below the candlesticks, as shown below.
In this case, the down fractal is usually a bullish sign while the up fractal is a bearish sign. This happens because the down fractal is usually followed by a bullish sign while an up fractal is usually bearish.
How it works
There are three key principles that are used to develop the Fractals indicator.
First, the energy in the market follows the path of least resistance. For example, in most cases, a currency pair or stock that is falling, will always keep falling until it finds a strong opposite energy.
Also, in line with this, you will always exit a trade when the pain of losing a dollar is bigger than the pain of losing another dollar.
Second, the path of least resistance is determined by the underlying and unseen structure of the market.
Finally, this underlying and unseen structure can be discovered and altered.
The key elemetns of an asset’s structure
Most importantly, when developing the fractal indicator, Williams identified four key elements of an asset’s structure. The four elements are the parts or components of the trade, plan, power source, and purpose.
To be fair, traders should not strive to understand all these concepts. Instead, they should only know how and when to apply the indicator successfully.
How to use the fractals indicator
The Fractals indicator is provided by TradingView and other advanced trading platforms. It is not provided in default in the MT4 and MT5 platforms. Therefore, to use it there, you need to manually download it and add it to the trading platform.
Day traders use the fractals indicator in several ways. Some use it to complement other indicators like the moving average, Relative Strength Index (RSI), and the market facilitation index, among others.
Other traders use it to confirm a bullish or bearish trade. Further, some traders use the fractal indicator to determine the highest and lowest points of an asset while others use it to identify entry and exit points.
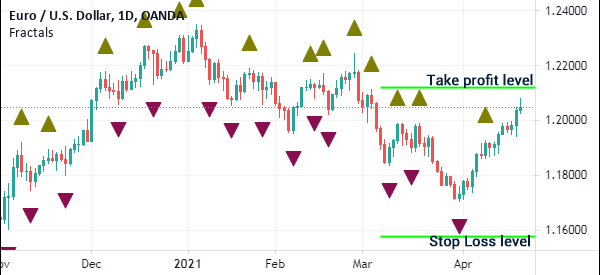
Others use the indicator to find stop-loss levels. In the chart below, if you are long the EUR/USD pair, you could have placed the stop-loss at the lower side of the down fractal and the take-profit level above the two up fractals.
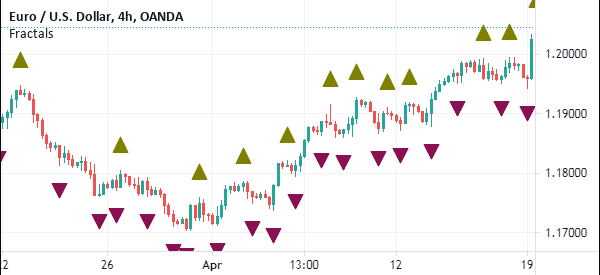
As mentioned, you can use the fractals to find areas of potential breakouts. You do this by looking at the current level of the fractal and comparing it with the previous one. In this case, a buy breakout usually happens when an asset’s price moves above the last upward fractal. Similarly, a short breakout happens when the price drops below the downward fractal.
Pros of using the William’s Fractal indicator
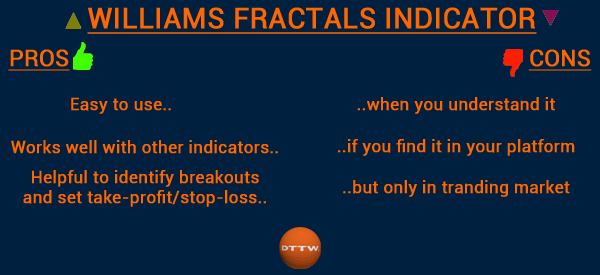
There are several benefits of using this indicator. They include:
- Relatively easy to use, especially when you grasp the concept.
- Are helpful when you are setting take-profits and stop-losses.
- Can also help you identify areas of potential breakouts.
- Can easily be used with other indicators
Cons of using the Fractal indicator
- The indicator is relatively difficult to understand.
- You can only use it in a trending market.
- It is often viewed as an outdated technical indicator.
- You cannot find it by default in MetaTrader, the most popular trading platform.
Final thoughts
Bill Williams contributions to technical analysis cannot be underestimated. He created some useful indicators that have been used for decades. The Fractals is one of the least known of all indicators that he created. Yet, as seen above, it can be ideal for showing you support and resistance levels.
External Useful Resources
- Williams’ Fractal Strategy or the Entire Trend in Profit – Dew in Forex
