Technical indicators are excellent tools used to predict the direction of a financial asset. Interestingly, most indicators are derived from other indicators. For example, the Bollinger Bands was developed by using the concepts of moving averages and standard deviation.
Similarly, the envelopes was created by tweaking the moving averages.
In this report, we will look at the Williams %R (Williams Percent Range), which was developed by using the same concepts as the Stochstic Oscillator.
What is the Williams %R?
The Williams %R (or %R) is an indicator that was developed by Larry Williams, a well-known market technician. The indicator is used to identify the relationship between the last closing price of a financial asset with the highest and lowest prices of the asset.
What does it tell you?
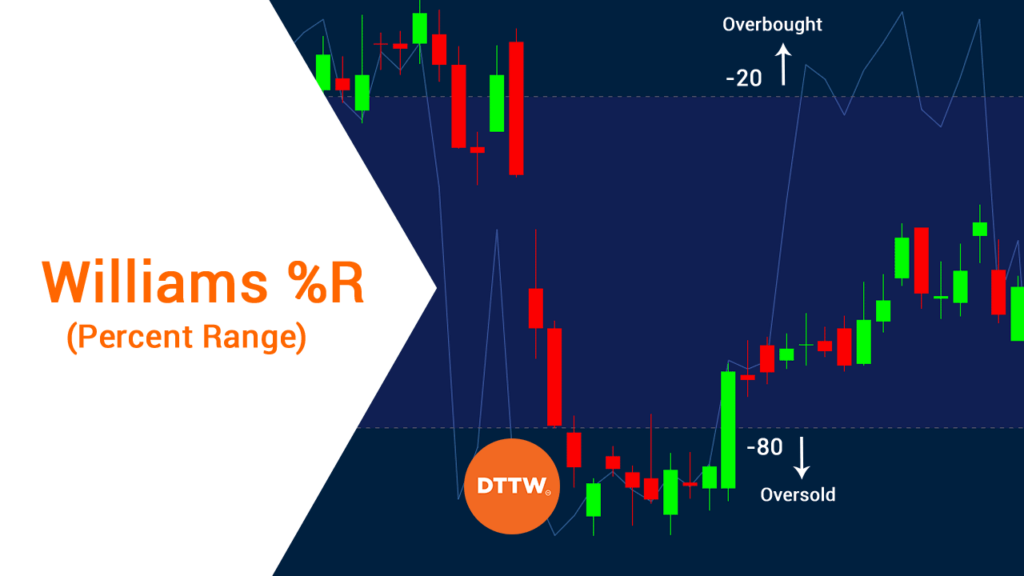
The Williams %R typically shows the levels of the relative close of a financial asset compared to the highest level of the period under consideration. Like many other oscillators, this tool can help you identify when a currency is Overbought or Oversold (between -20 and zero the former, between -80 and -100 the latter).
Percent Range vs Stochastic
The difference between %R and Stochastic is that the latter looks at the relationship between the close and the lowest price. In its calculation, the indicator corrects for the Stochastic’s weakness by multiplying the figure by -100.
Therefore, when applied in a chart, the fast oscillator and the Williams %R indicator, they always show the same thing.
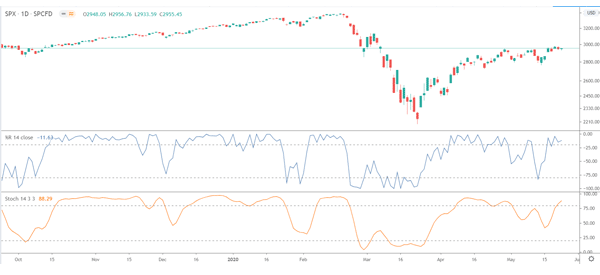
The only difference is that the two have different scaling, as shown on the chart below. For example, while Williams range from 0 to -100, the Stochastic range from 0 to -20.
How to calculate it
As mentioned, the indicator is eerily similar to the Stochastic oscillator. The process of calculating it is relatively simple and the formula is:
| %R = (Highest high – Close) / (Highest high – Lowest low) X -100 |
In other words, you first identify the lookback period. Then, you take the highest high and the lowest low.
You subtract the close from the highest high and then divide the figure with the difference between the highest high and lowest low. Finally, you multiply the figure with minus 100.
Here is an example of the Williams %R. Assume that the stock of a company closed at 90.
In this period, it reached a highest level of 100 and the lowest level of 80. Therefore, the indicator will be:
| (100-90) / (100 – 80) X -100 = (10 / 20) X -100 = -50 |
As always, as a trader, you don’t need to know how it is calculated. All you need to know is how to implement it on the trading platform.
Also, while the default period is usually 14, you can tweak it and use your preferred one.
Best settings of the Williams %R
The Williams %R is a relatively simple indicator to use. There are two main things that you can change in its settings. First, you can change the lookback period. While the default period of the indicator is 14, you can change it to match your trading strategy.
The next thing you can change is the color of the indicator. You could change the line color and the overbought and oversold levels.
Williams Percent Range Strategy: Oversold and Overbought
As mentioned above, the Williams %R indicator moves between 0 and minus 100. In this, -50 is an important number because it is the mid-point.
Therefore, if the line crosses minus 50, it means that prices are trading in the upper section of their high-low range and vice versa.
A move below -80 shows that the price is close to its low for the session while readings above -20 show that the price is near its high. These are the oversold and overbought levels respectively.
As we have written before, overbought and oversold levels are not necessarily signs to sell and buy respectively. Always remember that an asset can remain in an overbought or oversold position for days or even months.
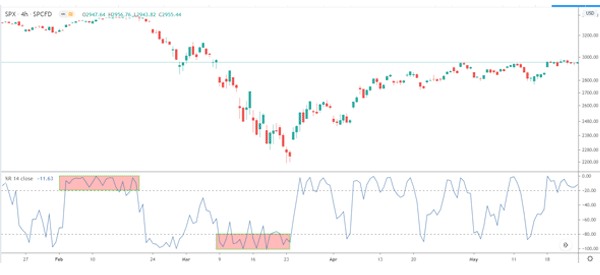
A good example of this is shown in the chart below.
Example of the Williams R indicator
We have looked at how to calculate and how to interpret the Williams %R indicator. Now, let us look at a real example of it in use.
First, the Williams %R indicator works best when the price of an asset is trending. It does not work well when the price is in consolidation.
Second, the key levels to watch are -20 and -80. A move above -20 means that the price is getting overbought while -80 shows that the price is oversold.
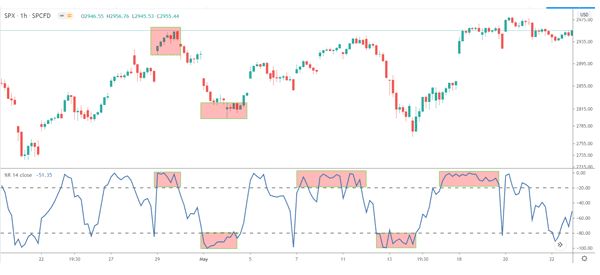
As seen above, the price can remain in an overbought and oversold level for days or months. Therefore, the indicator does not tell you where to buy or sell. Instead, it gives you a feel of the market.
Combining Williams %R with other indicators
No indicator is best used alone. Therefore, it is always important for you to combine it with other indicators. Some of the most common indicators you can use are trend ones like the moving average and Bollinger Bands. You can use it to confirm an existing trade or a reversal.
A good way to use it to combine the percent range with other indicators like the moving average and the RSI. Also, you should use other tools like the hanging man, triangle, and Doji patterns.
Advantages of using the Williams %R
There are several benefits of using the Williams %R indicator.
- Easy to calculate.
- Included in most trading platforms.
- Complements the Stochastic indicator.
- Easy to interpret.
The main disadvantage of the Williams %R indicator is that it does not tell you where to buy or sell.
Also, the indicator can remain in the oversold and overbought levels for long.
› Related: When to enter and exit a trade?
Final thoughts
The Williams %R indicator is a simple-to use indicator. As a trader, we recommend spending a considerable amount of time experimenting with it in a demo account.
This means tweaking the period and identifying optimal settings.
External Useful Resources
- Williams Percent R Indicator (%R) – Williamspercentr.com
- Does Williams %R work as a technical signal? – Quora
