The Woodies Commodity Channel Index (CCI) is a technical indicator that is a slight modification of the traditional CCI indicator. It was proposed by Ken Wood, who is also well-known for the Woodies pivot point system.
In this article, we will look at the Woodies CCI indicator.
What is the CCI indicator?
The CCI is an oscillator that was developed by Donald Lambert in the 1980s with the eye on the commodity’s market. Today, it is used in trading all assets, including currencies, commodities, equities, and exchange-traded funds (ETFs), among others.
CCI calculation
The CCI is calculated using the formula below:
| CCI = (Typical Price – 20-period SMA of TP) / (0.015 x Mean Deviation) |
In this case, the typical price is calculated by finding the average of the high, low, and closing prices. When applied, the CCI measures the present price of an asset relative to the average price over a given period of time.
What is the Woodies CCI? Key parts
The Woodies CCI is a modification of the indicator. It has several key parts, including:
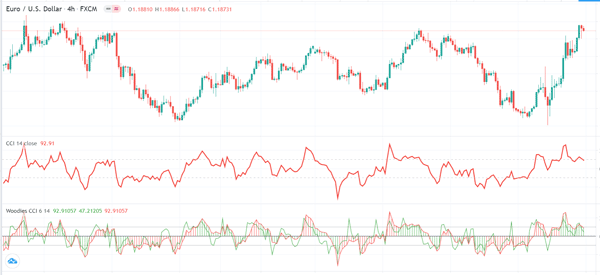
- CCI turbo – This line is used to determine the trend and determine areas of entering the price. According to Ken Wood, the setting for this turbo should be set at 14. It is shown in green in the chart below.
- Trend CCI – This is the CCI indicator. The ideal period for this is 14.
- Zero line – This line is the main support and resistance level and is shown in black.
- + and – 100 – The two are the least squared moving average prices.
There are other parts of the Woodies CCI indicator known as sidewinder and chop zone. Sidewinder, which is plotted on the +200 and -200 levels, takes into account the relationship between the EMA and LSMA of a price.
In most cases, when its price turns green, an assets price is usually trending. On the other hand, when it turns yellow, it means that the trend is developing. Finally, when it is red in color, it shows that there is no trend.
The chop zone, on the other hand, is plotted on the +100 and -100 levels to visualize the difference in between close price and its EMA. Its colors are yellow, lime, light green, dark green, cyan, light orange, dark orange, light red, and dark red.
The chart below shows the EUR/USD pair with the CCI and the Woodies CCI indicator.
To be fair. Calculating both the CCI indicator and the Woodies CCI can take time. However, like we have written before, as a trader you should only focus on how to apply the indicator and use it.
Indeed, some of the best day traders don’t know how to calculate the Woodies CCI (and many other indicators).
How to use the Woodies CCI indicator
Like most oscillators, the Woodies CCI is used to identify oversold and overbought positions in a trade. When the price is oversold, it is usually a signal to buy and when it is overbought, it is usually a signal to sell.
Check out the asset
The first approach of using the Woodies CCI is to check out whether the asset is in a narrow range or is trending. Like all oscillators, it tends to be almost impossible to use it in a ranging market.
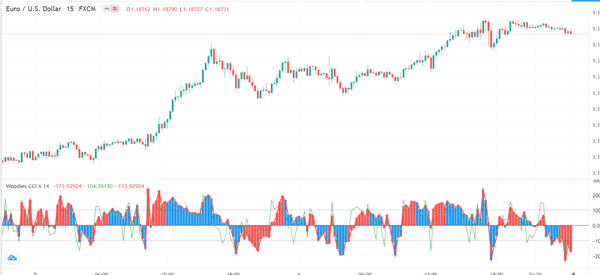
Focus on the centreline (if trending)
Second, if the price is trending, you should focus on the centreline. A bullish trend is confirmed when the CCI line and the histograms move above the neutral line, as shown in the chart below.
Similarly, a sell signal emerges when the CCI and the histogram are below the neutral line.
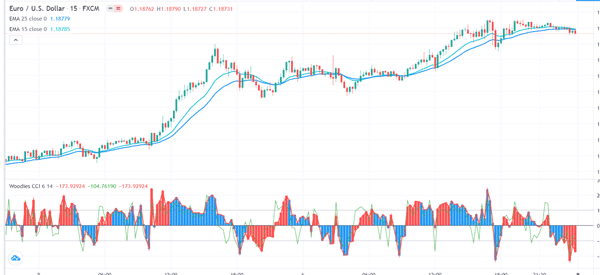
Combine with other indicators
The other approach when using the Woodies CCI is to combine it with other indicators. Ideally, some of the best indicators to combine with it are trend indicators like moving averages, average directional index, and Bollinger bands, among others.
In the chart below, we see that the CCI used with the 25-day and 15-day moving averages.
Woodies CCI vs CCI indicator
A common question is on the difference between Woodies CCI and the popular Commodity Channel Index (CCI).
The latter is an indicator that was created by Donald Lambert to identify cyclical turns in the commodities market. It measures the current price level relative to its average price over a given amount of time.
The indicator is usually high when prices are far above their average and is relatively low when prices are below their average. As a result, many traders use it to identify overbought and oversold levels.
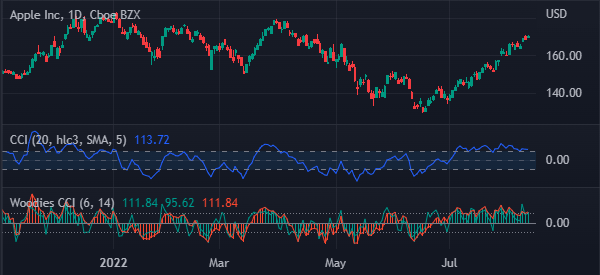
The chart below shows the CCI and Woodies CCI added to the daily chart of Apple shares.
Final thoughts
The Woodies CCI is not one of the most popular technical indicators in the market. Indeed, it is not provided as a default by most trading platforms, including the MetaTrader. To use it, you need to download and install it from the marketplace.
Also, the buy and sell signals are usually not easy to see, which means that you need to take time to create strategies and test it well.
External Useful Resources
- Trading with Woodies CCI Patterns – Pipbear
